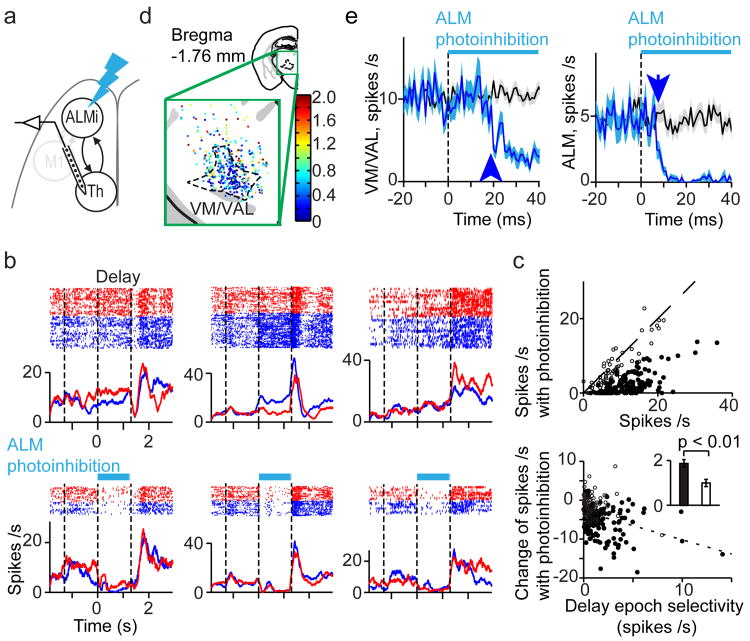
Figure 6. ALM drivesthalamus.
a. Recording in VM/VAL during ALM photoinhibition (panels b-e).
b. Three example neurons. Same format as Fig. 2b.
c. Top, spike rates during 20-120 ms after photostimulus onset. Filled circles, neurons that were significantly modulated by ALM photoinhibition (P < 0.05, t-test). Dotted line, unity line. Bottom, relationship between change of spike rates due to photoinhibition and delay epoch selectivity. Filled circles, same as in the top. Dotted line, linear regression (slope = -0.73, Pearson correlation coefficient = -0.33). Inset, delay epoch selectivity of significantly (black bar) and non-significantly (white bar) modulated neurons (P = 0.002, t-test).
d. Locations of recorded neurons in thalamus. Neurons were color coded based on their spike rate during ALM photoinhibition normalized by the spike rate without ALM photoinhibition (Methods).
e. Left, time course of VM/VAL activity during ALM photoinhibition (n = 201 neurons). Right, time course of activity in ALM pyramidal neurons during ALM photoinhibition (n = 256 neurons). Same format as Fig. 3e.

