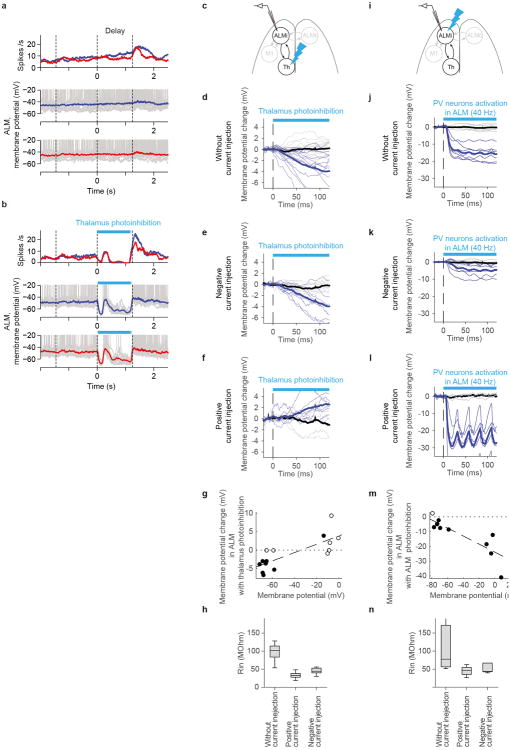
Extended Data Figure 5. Hyperpolarization of ALM neurons during thalamus photoinhibition is caused by loss of excitation.
a-b. Example ALM neuron during thalamus photoinhibition. Top, peri-stimulus time histogram (PSTH) during control (a) and photoinhibition trials (b). Correct contra- (blue) and ipsi- (red) trials only for control trials. All trials were included for photoinhibiting trials. Bottom, membrane potential during each trial type (10 trails each). Red and blue lines indicate the trial averaged membrane potential. Dashed lines separate behavioral epochs.
c-h. The time course of membrane potential changes in ALM putative pyramidal neurons after thalamus photoinhibition (non-behaving animals). (c) Recording in ALM during thalamus photoinhibition (relevant to panels below). Note: in this experiment thalamic photoinhibition was weak because this was based on cre-dependent ChR2 AAV injected near the VM/VAL projection zone of TRN in Gad2-IRES-Cre mice. Photoinhibition is much more potent in VGAT-ChR2 mice because the vast majority of TRN and SNr neurons are ChR2 positive. (d) Membrane potential changes after light onset were averaged during control (black) and photoinhibition (light blue) conditions (n = 14 cells). Thin lines, traces of individual neurons. Consistent with data of behaving VGAT-ChR2 animals (Fig. 3g), we observed weaker but significant hyperpolarization after light onset.(e) The time course of membrane potential change in ALM neurons during hyperpolarization with negative current injection (n = 9 cells). Because the membrane potential is near the reversal potential for inhibitory currents, but far from excitatory currents, the driving force for inhibition was reduced, and apparent excitatory signals were amplified. (f) The time course of membrane potential change in ALM for neurons during depolarization with positive current injection (n = 6 cells). Because the membrane potential is near the reversal potential for excitatory currents but far from inhibitory currents, driving force for excitation is reduced, and apparent inhibitory signal is amplified under this condition. (g) Relationship between membrane potential in non-photoinhibition condition vs. membrane potential changes with photoinhibition (ΔmV). Membrane potential and ΔmV were calculated between 100 ∼ 120 ms after the onset of light. Black circles: cells with significant change of membrane potential. Dotted line with broad dash indicates linear regression. Because input resistances during positive and negative current injections were similar (p = 0.05, ranksum test) (h), we plotted data from positive and negative current injections (i.e. excluding data without current injection because the input resistances were significantly higher). Slope of linear regression is larger than 0 (p < 0.0001, bootstrap), implying that hyperpolarization was larger during negative current injections. Hyperpolarization is therefore caused mainly by loss of excitation. Note that conductance changes affect amplitude of ΔmV but not the direction of change compared to the baseline. Moreover, we used low levels of photoinhibition (around 5mV) so that changes in the leak conductance should be minor compared to changes in synaptic conductance. None of the measurements were corrected for junction potential.
i-n. The time course of membrane potential change in ALM neurons during photoactivation of local parvalbumin (PV) positive neurons expressing ChR2. This experiment shows that silencing by increases in inhibition can be distinguished from loss of excitation with our method. Figures numbering as in c-h. (i) Recording in ALM during photoinhibition in PV-ires-cre mice crossed with Ai32 (Cre dependent ChR2 line) (relevant to panels below). We observed strong hyperpolarization of ALM neurons (n = 7 cells) (j). Furthermore, when we performed current injections under this condition, we found enhanced hyperpolarization during positive current injection and reduction of hyperpolarization during negative current injection (n = 5, 6 cells, respectively) (k and l). This is consistent with hyperpolarization caused by increases in inhibition. (m) Slope of linear regression is smaller than 0 (p < 0.0001, bootstrap), which indicates hyperpolarization was amplified more during positive current injection. This implies that hyperpolarization is mainly due to increased inhibition. Because input resistances during positive and negative current injections were similar (p = 0.662, ranksum test) (n), we combined data from positive and negative current injections (i.e. excluding without current injection data because the input resistance was significantly different). Note that the effect of current injection is opposite from that of thalamus inactivation (cf g).

