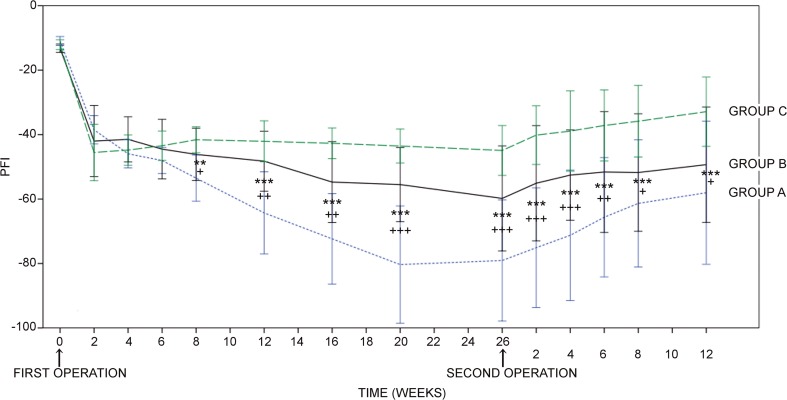
Fig. 2.
Results of the walk track analysis. Groups B and C show significantly higher peroneal function index (PFI) values compared to group A from 8 weeks onward. There are no significant differences between groups B and C. The data are analysed with the analysis of covariance with Tukey–Kramer adjustment for multiple comparisons. *p < 0.05, **p < 0.01, ***p < 0.001 comparison of group A to C, +p < 0.05, ++p < 0.01, +++p < 0.001 comparison of group A to B. Error bar, ± 1 SD

