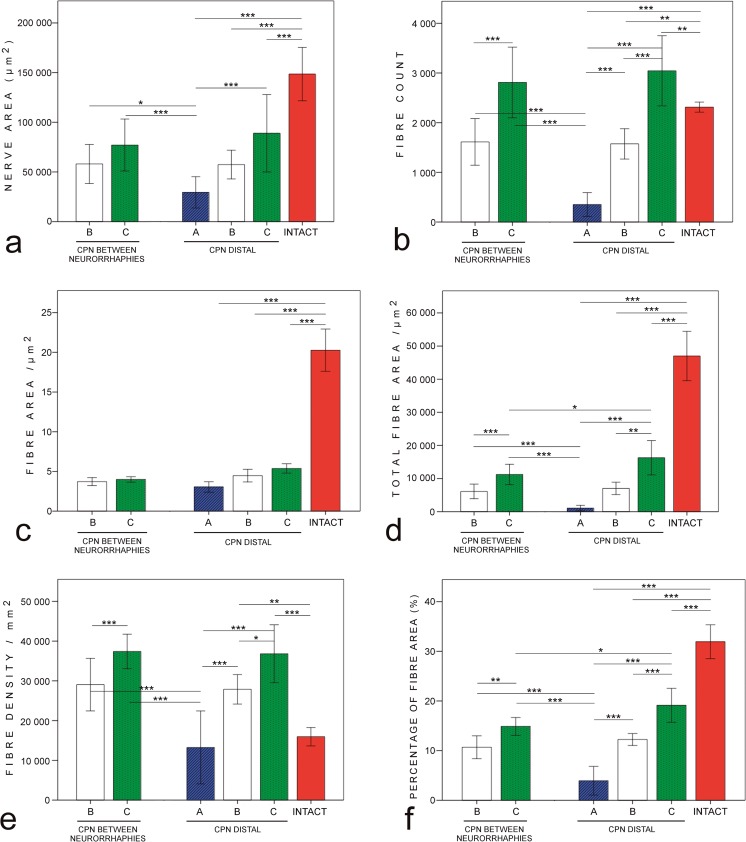
Fig. 3.
Morphometric results of the common peroneal nerve. Group C shows statistically significantly higher values of all morphometric outcomes except mean fibre area compared to group A. Group B reaches higher values of fibre count (b), fibre density (e), and percentage of the fibre area (f) compared to group A. When comparing groups B and C, group C shows higher values of fibre count (b), total fibre area (d), fibre density (e), and percentage of the fibre area (f) both at the site between neurorrhaphies and distal to common peroneal nerve. *p < 0.05, **p < 0.01, ***p < 0.001. Bars express the mean values, error bar ± 1 SD

