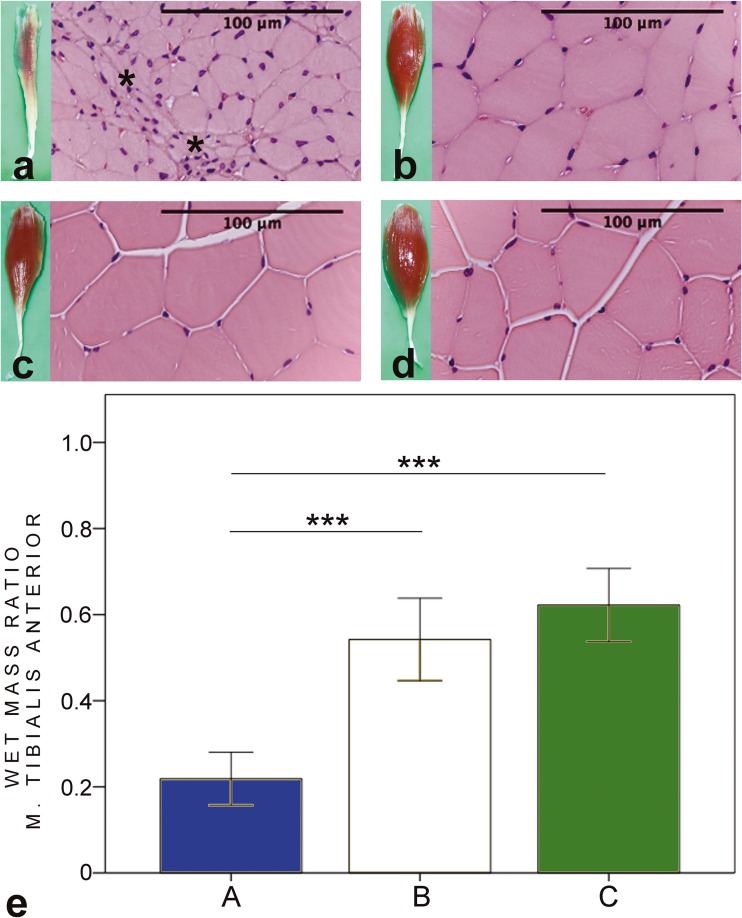
Fig. 5.
HE-stained biopsies and macroscopic figures of the tibialis anterior muscle of the intervention groups (a–c) and control sample from the contralateral side (d). In group A (a), the muscle fibres are small and angular-shaped (asterisk). In groups B and C, focal signs of atrophy can be seen. The wet mass ratio (e) is significantly higher in groups B and C compared to group A. In group A, the wet muscle mass value of tibialis anterior (TA) muscle is 22 (6.2)% of the contralateral side value. In groups B and C, the values are 54 (9.6)% and 62 (8.5)%, respectively. *p < 0.05, **p < 0.01, ***p < 0.001. Bars express the mean values, error bar ± 1 SD

