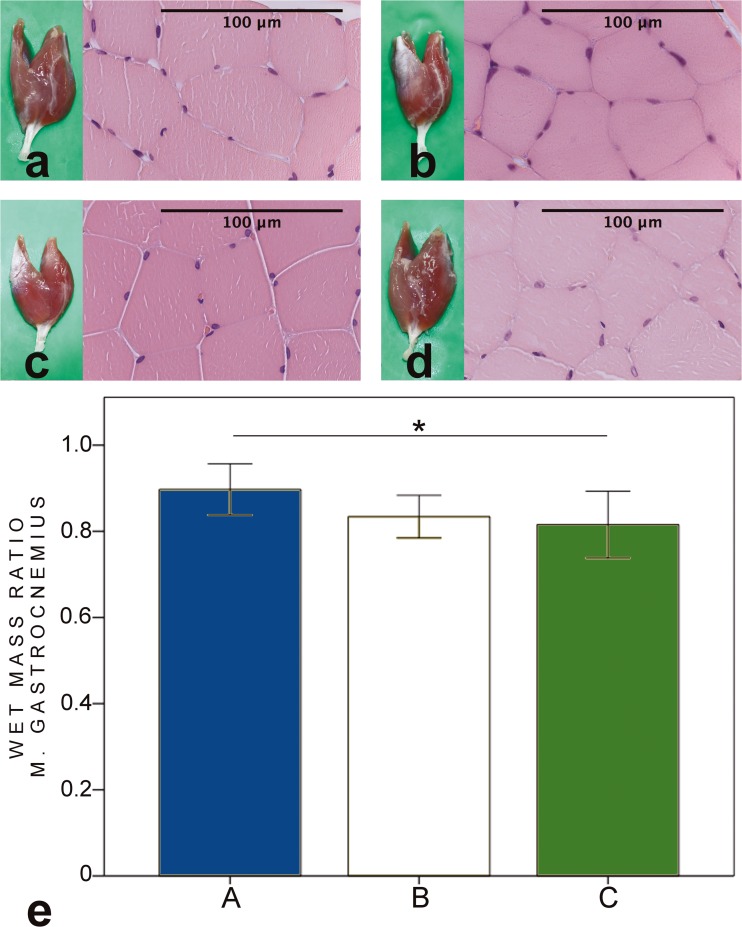
Fig. 7.
HE-stained biopsies and macroscopic figures of the gastrocnemius muscle of the intervention groups (a–c) and control sample from the contralateral side (d). Muscle architecture was well preserved in all groups. However, mild focal signs of atrophy were detected in groups B and C. In wet mass ratio calculations (e), group A (89 (6.0) %) got higher values compared to group C (82 (7.8) %). Groups B (83 (4.9) %) and C did not differ. *p < 0.05, **p < 0.01, ***p < 0.001. Bars express the mean values, error bar ± 1 SD

