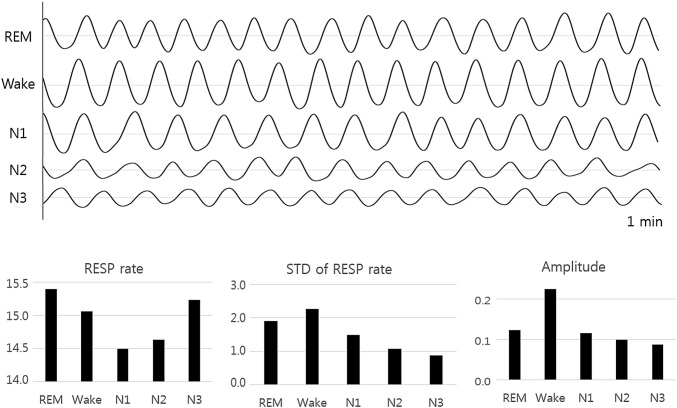
Fig. 1.
Variation of respiration rate and amplitude of sleep stages. The upper part shows the recorded respiratory signals during 1 min for each sleep stage and the lower part shows the calculated average respiration rate, standard deviation of respiration rate, and average amplitude for each sleep stage

