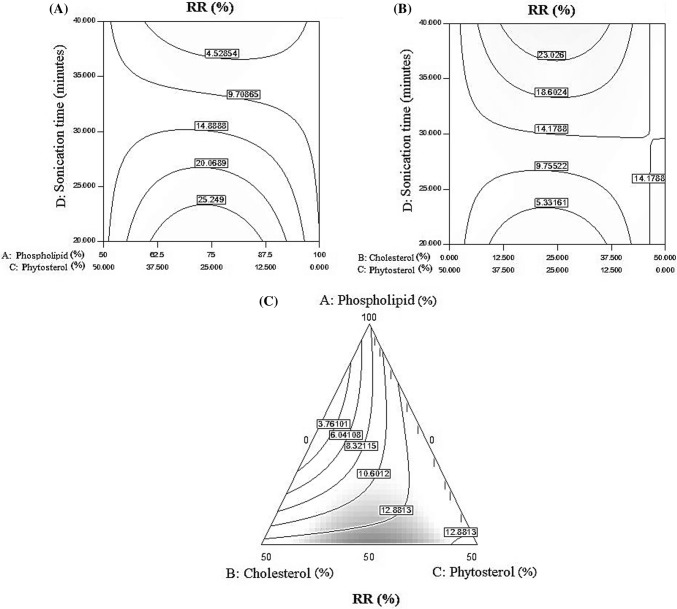
Fig. 5.
(A) The ratio of phospholipid to cholesterol, and the effect of time of sonication on control release, (B) The effects of cholesterol to phytosterol ratio and sonication time on RR%, (C) The effects of three phospholipids, cholesterol and phytosterol factors on control of vitamin C release in samples

