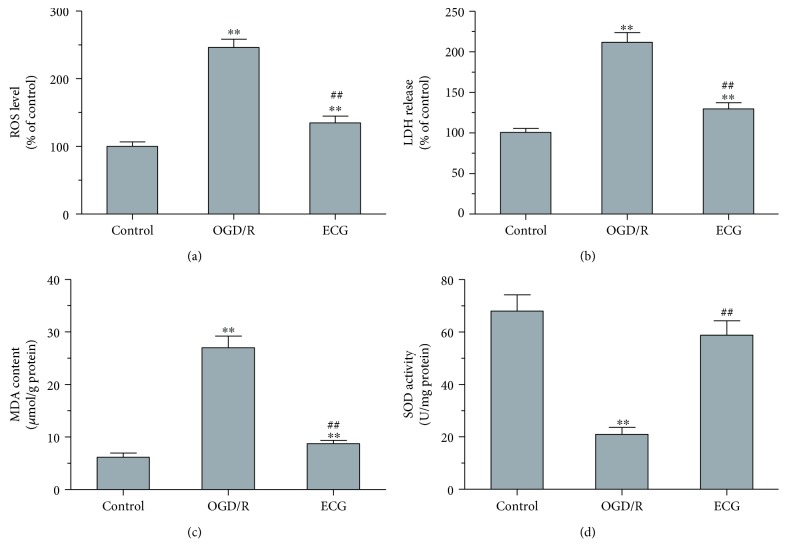
Figure 2.
ECG affected ROS, LDH, MDA, and SOD in HBMVECs after OGD/R. Levels of ROS (a) and MDA (c), SOD activity (d) in cells and LHD releasing level (b) were detected using assay kits correspondingly. Data was given as mean ± SD, n = 6. ∗ P < 0.05 and ∗∗ P < 0.01 compared with control, # P < 0.05 and ## P < 0.01 versus cells after OGD/R treatment with solvent (OGD/R or solvent control group).

