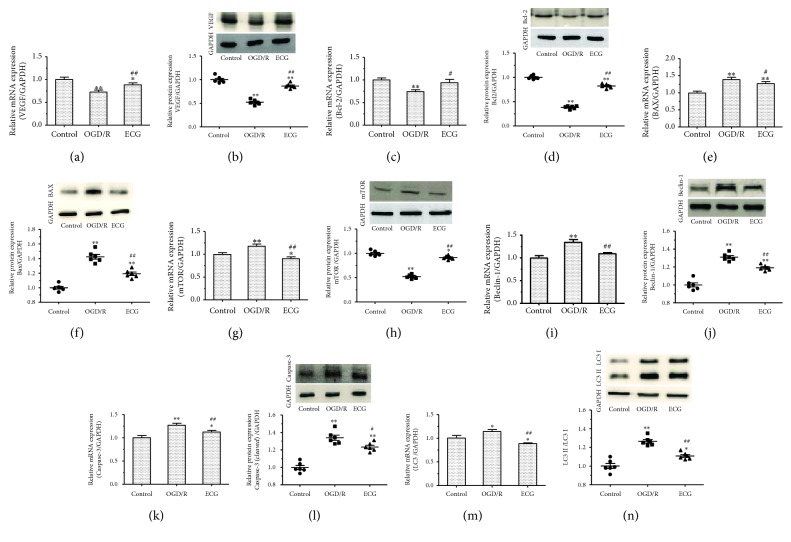
Figure 4.
The effect of ECG on mRNA and protein expression of VEGF, Bcl-2, BAX, LC3B, Caspase 3, mTOR, and Beclin-1 in HBMVEs after OGD/R. (a), (c), (e), (g), (i), (k), and (m) represent relative mRNA expression of VEGF, Bcl-2, BAX, LC3B, Caspase 3, mTOR, and Beclin-1 measured by qPCR. Protein expression of VEGF, Bcl-2, BAX, LC3B, Caspase 3, mTOR, and Beclin-1 determined by western blotting is shown in (b), (d), (f), (h), (j), (l), and (n) correspondingly. Data was given as mean ± SD, n = 6. ∗ P < 0.05 and ∗∗ P < 0.01 compared with control, # P < 0.05 and ## P < 0.01 versus cells after OGD/R treatment with solvent (OGD/R or solvent control group).

