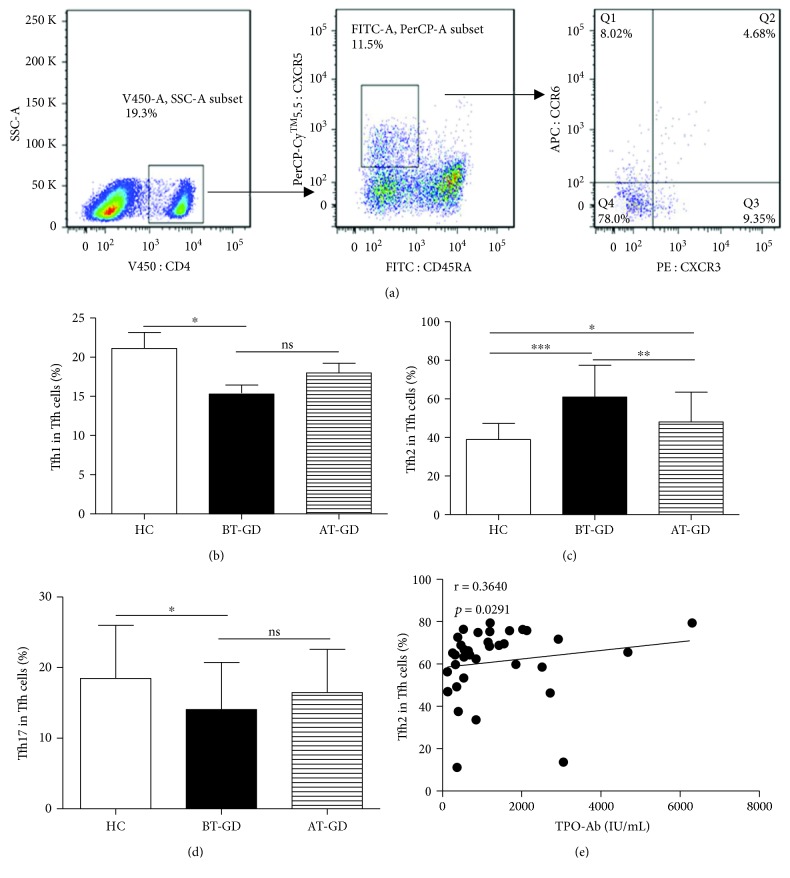
Figure 2.
Frequency of circulating Tfh cell subsets in GD patients. (a) Representative dot plots demonstrate CXCR3 and CCR6 expression in cells gated for CD4, CD45RA, and CXCR5; (b) lower proportions of Tfh1 cells in GD patients; (c) overabundance of Tfh2 cells in GD patients; (d) decreased Tfh17 cells in GD patients; (e) relation of Tfh2 subset proportions with levels of serum TPO-Ab in GD patients. ∗p < 0.05, ∗∗p < 0.01, and ∗∗∗p < 0.001; ns: no significant difference. Tfh1 cells, CXCR3+CCR6−Tfh cells; Tfh17 cells, CXCR3−CCR6+Tfh cells; Tfh2 cells, CXCR3−CCR6−Tfh cells. GD patients (BT: 36, AT: 21) and 20 HC were enrolled in this study.

