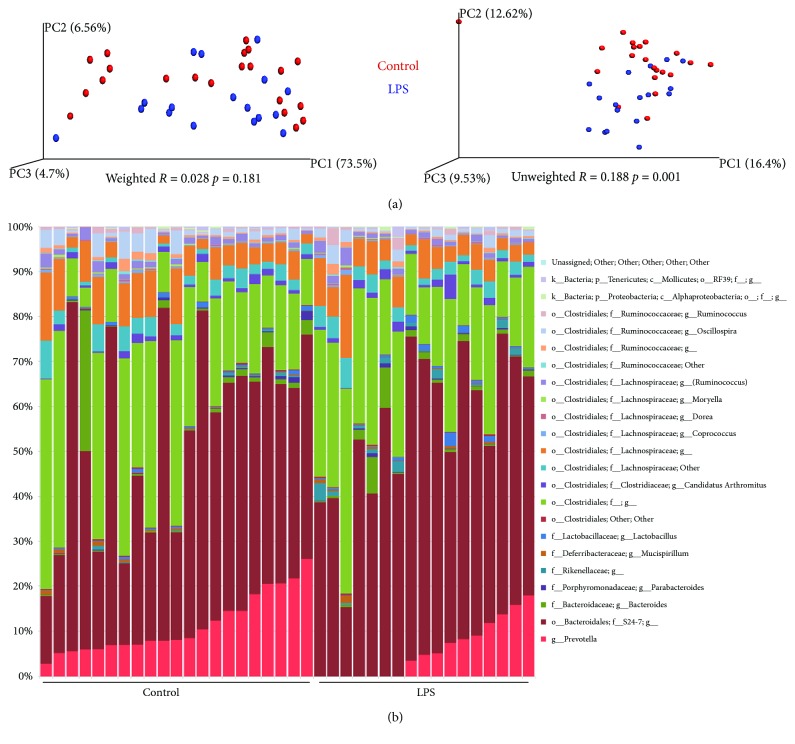
Figure 4.
Weighted and unweighted principal component analysis plots showing microbiota clustering (a) and bar chart demonstrating relative abundances of genera (b) after 16S sequencing of feces of 40 (18 female and 22 male) four-week-old C57BL/6NTac mice given either LPS (n = 18) or PBS (n = 22) orally daily from birth until weaning at four weeks of age.

