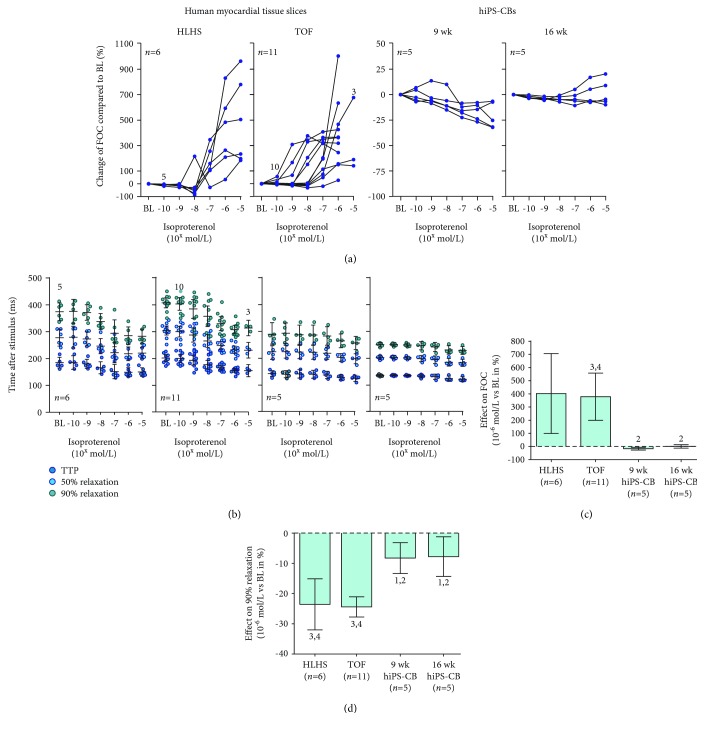
Figure 6.
Response to ß-adrenergic stimulation by ISO. (a-b) Effect of ascending ISO concentrations in single experiments with human myocardial tissue slices (HLHS: n = 6 of 5 patients, left panels; TOF: n = 11 of 5 patients, middle left panels) and hiPS-CBs (9 wk: n = 5, middle right panels, 16 wk: n = 5, right panels). Numbers in the graphs indicate deviations from reported overall n numbers at individual experimental steps. (a) Change in force of contraction (FOC) in relation to baseline (BL). The y-axis differs between myocardial tissue slices and hiPS-CBs. (b) Effect on time to peak (TTP) as well as time to 50% and 90% relaxation. Lines and error bars represent the mean and 95% CIs, respectively. The y-axis is the same for all groups. (c-d) Comparison of average effect sizes of 10.6 mol/L ISO relative to baseline for inotropic ((c); FOC) and lusitropic ((d); time to 90% relaxation) response. Data are expressed as mean ± 95% CI. Numbers above error bars indicate p values <0.05 vs. HLHS (1), TOF (2), 9 wk hiPS-CBs (3), and 16 wk hiPS-CBs (4). Effect on FOC: ANOVA, p = 5.06 × 10⁻⁴; Games-Howell post hoc: HLHS vs. TOF: p = 1.00; HLHS vs. hiPS-CBs 9 wk: p = 0.057; HLHS vs. hiPS-CBs 16 wk: p = 0.067; TOF vs. hiPS-CBs 9 wk: p = 2.89 × 10⁻³; TOF vs. hiPS-CBs 16 wk: p = 3.95 × 10⁻³; and hiPS-CBs 9 wk vs. hiPS-CBs 16 wk: p = 0.085. Effect on time to 90% relaxation: ANOVA, p = 5.58 × 10⁻⁶, Hochberg post hoc: HLHS vs. TOF: p = 1.00; HLHS vs. hiPS-CBs 9 wk: p = 1.15 × 10⁻³; HLHS vs. hiPS-CBs 16 wk: p = 1.04 × 10⁻⁴; TOF vs. hiPS-CBs 9 wk: p = 1.54 × 10⁻⁴; TOF vs. hiPS-CBs 16 wk: p = 1.04 × 10⁻⁴; and hiPS-CBs 9 wk vs. hiPS-CBs 16 wk: p = 1.00.

