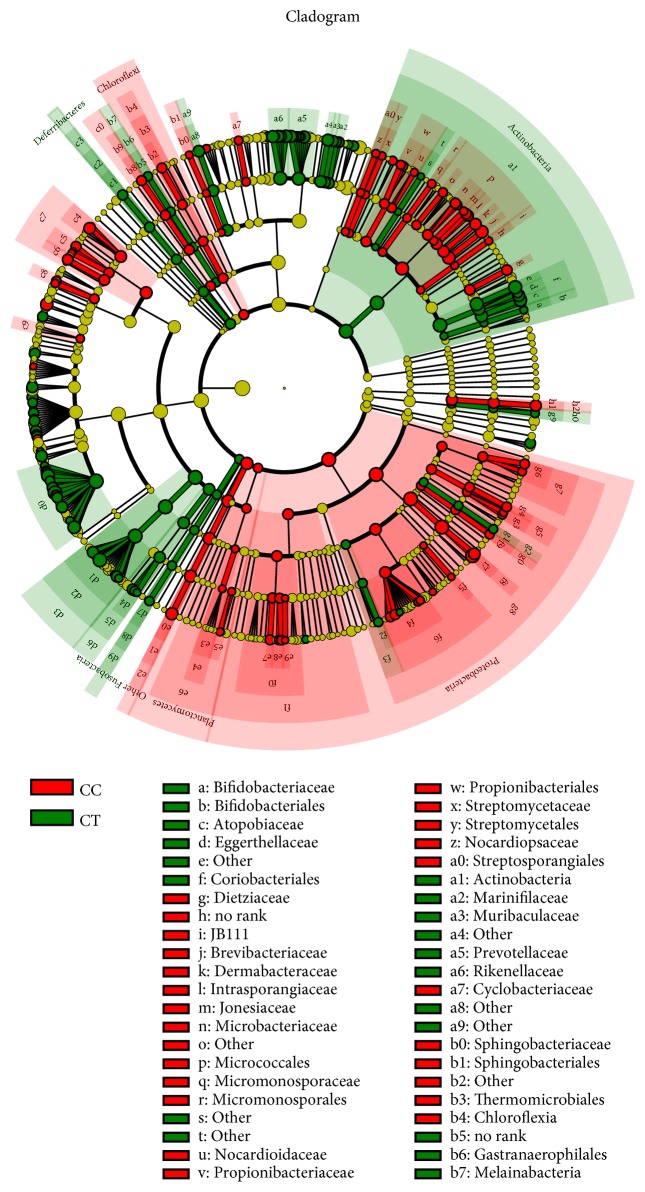
Figure 13.
The cladogram analyzed LEfSe of the ducks. The cladogram analysis of LEfSe and LDA (linear discriminant analysis) was done in CC and CT groups of ducks. The important microbiome of CC ducks is shown in red color, while that of CT birds is shown in green color. Ducks in CC groups had free access to swimming while birds in CT group were limited to land.

