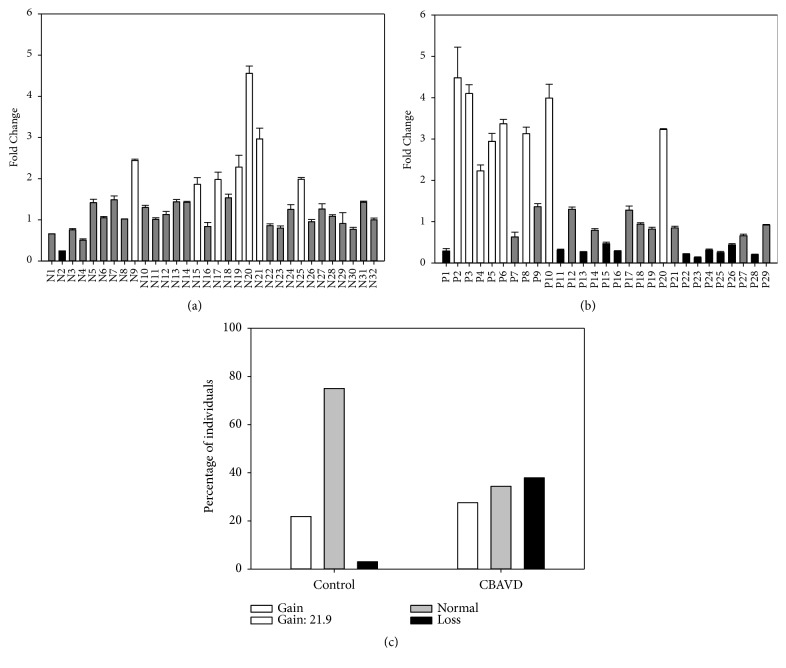
Figure 5.
Quantitative real-time PCR targeting SLC9A3. Fold change in SLC9A3 copy number relative to the endogenous reference gene ATP2B4 was compared for (a) fertile controls (N1–N32; set 1) and (b) CBAVD patients (P1–P29). Fold change was interpreted as normal (0.5–1.5, grey bar), loss (<0.5, black bar), or gain (>1.5, white bar). (c) Distribution of copy number variants in CBAVD patients and controls. White, grey, and black bars represent gain, no change, and loss of copy number, respectively.

