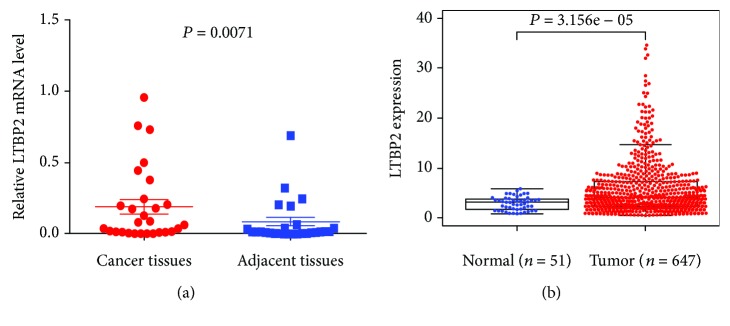
Figure 1.
LTBP2 mRNA expression in CRC tissues and cell lines. (a) LTBP2 mRNA expression was significantly higher in CRC tissues than in matched adjacent tissues. LTBP2 mRNA was detected by qRT-PCR, and relative quantification analysis was normalized to GAPDH mRNA (P = 0.0071). (b) In TCGA database, LTBP2 mRNA expression was also higher in CRC tissues than in normal colorectal tissues (P < 0.0001).

