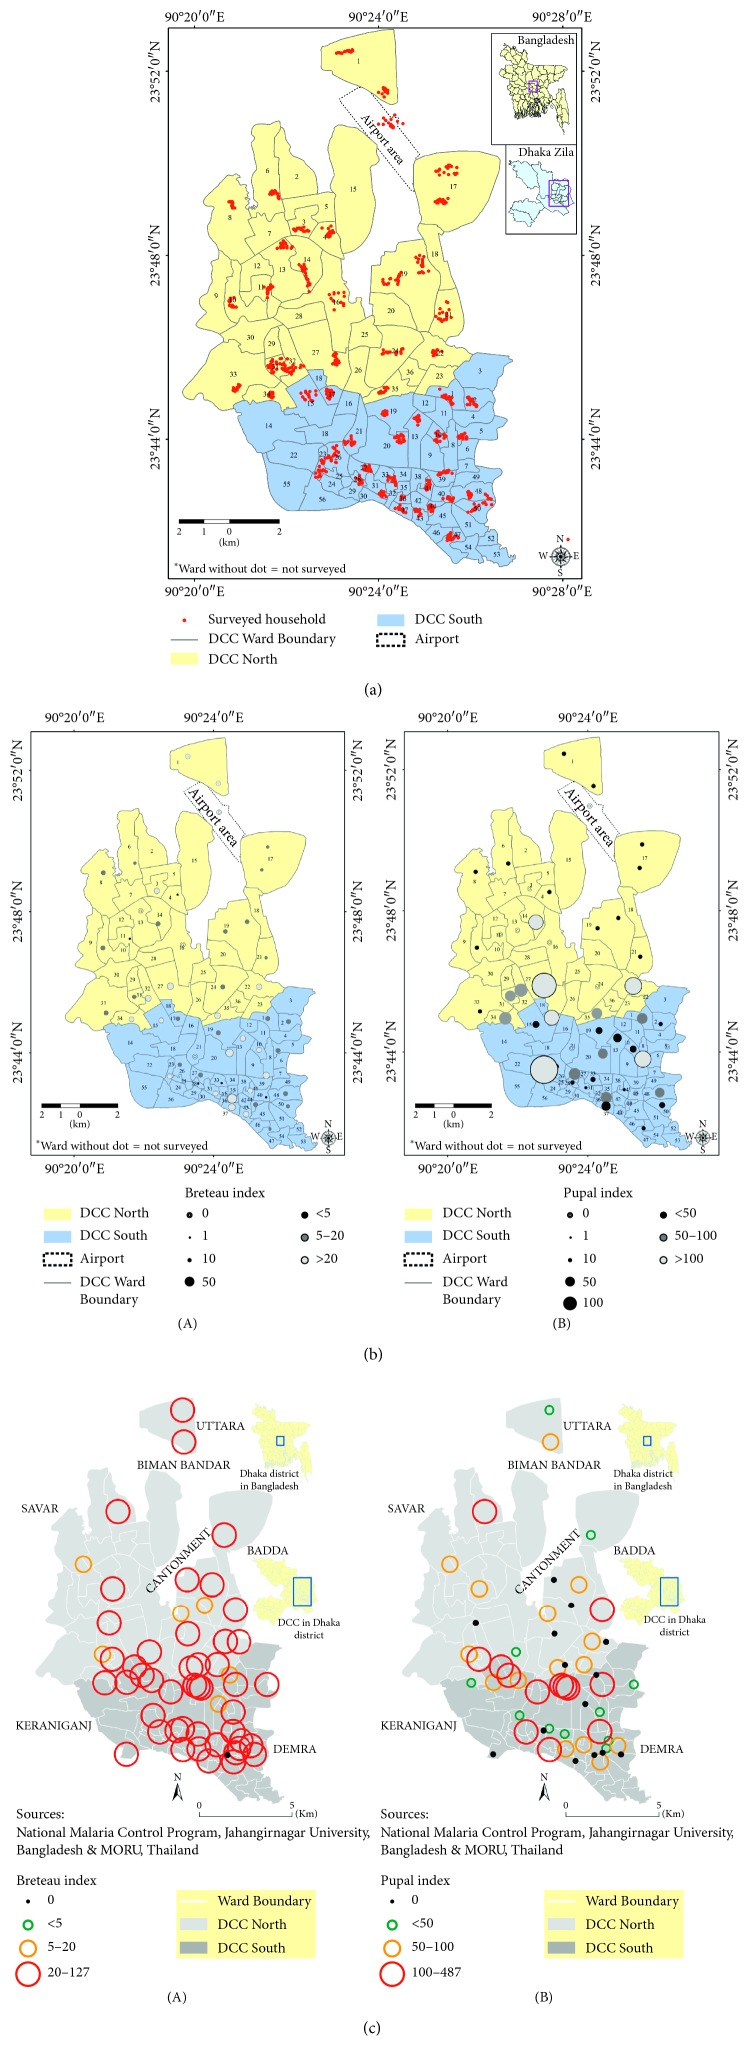
Figure 5.
Map showing the spatial distribution of surveyed households for Aedes and KAP study in Dhaka city areas (north and south city corporations) during the pre-monsoon and monsoon period, 2016 and 2017 (a), and spatial distribution of dengue larvae and pupae (b) in the surveyed areas of Dhaka city, and density of chikungunya vector(s) mosquitoes in Dhaka city corporations (North and South) during the monsoon period, 2017 (c), when dengue cases were mostly suppressed and an outbreak of chikungunya was reported for the first time in Bangladesh. The map also shows higher ranges of Breteau Index (BI) and Pupa Index (PI) in most of the surveyed areas. (a) Spatial distribution of surveyed household in Dhaka city corporation areas during the pre-monsoon period. (b) Density of dengue vector(s) both in larvae and pupal stages in Dhaka city during the pre-monsoon period. (c) Density of chikungunya vector(s) in Dhaka city corporations, 2017.

