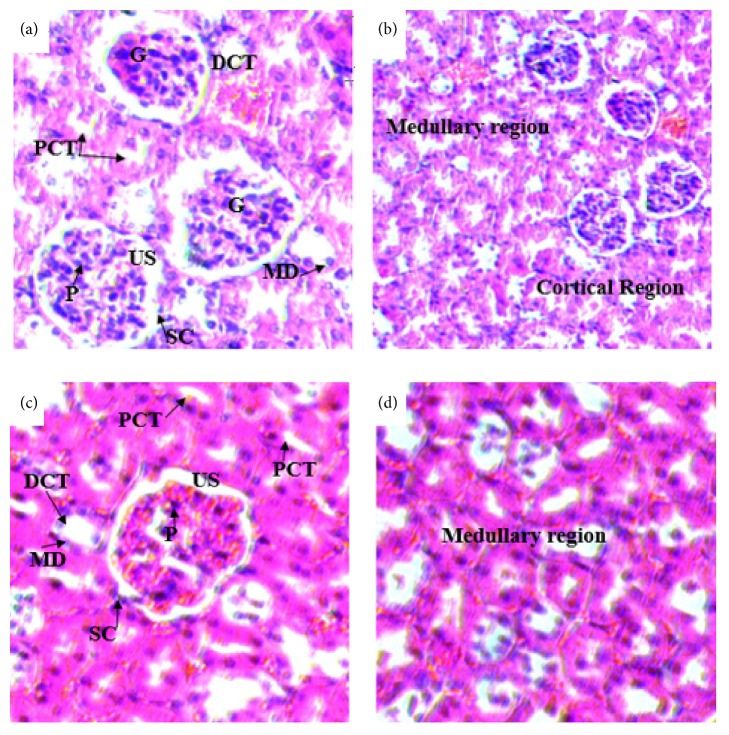
Figure 8.
(a) and (b) Photomicrographs of the kidney sections of rats treated with 1500mg/kg ((a) H & E x400 and (b) H&E x200). (c) and (d) Kidney sections of control rats (H&E-x400). PCT= proximal convoluted tubule, DCT= distal convoluted tubule, MD= macula densa, G= glomerulus, US= urinary space, SC= squamous cell, and P= podocyte.

