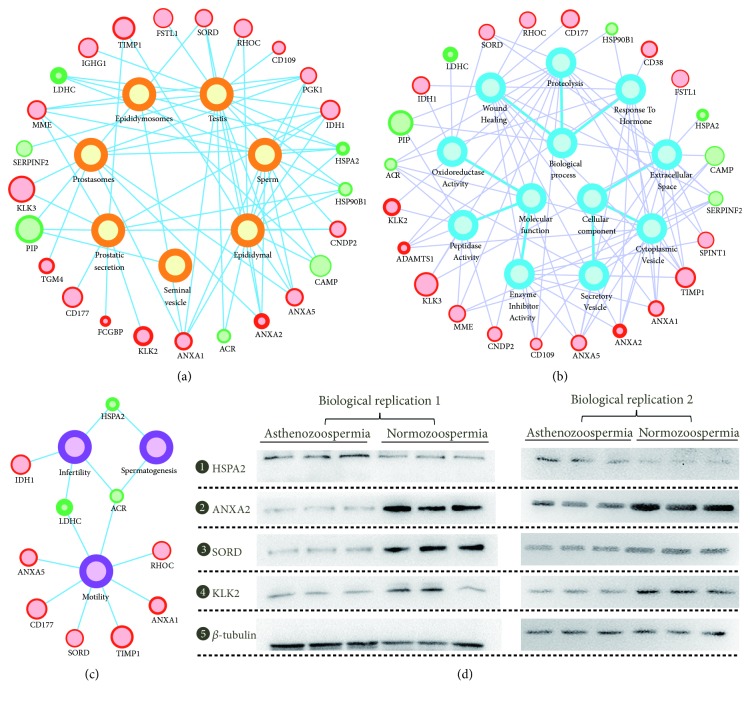
Figure 3.
Annotation and verification of the differentially expressed proteins. Relation networks for potential originations (a), GO annotations (b), and phenotype associations (c). The inner circle size and the border width represent the absolute and relative expression level, respectively. (d) Western blotting verification of four representative proteins.

