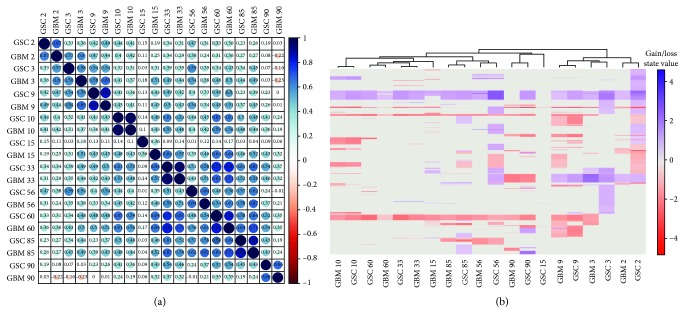
Figure 3.
Hierarchical clustering results in our cohort of 10 patients highlighted the intrapatient similarity. (a) Correlation map reporting Pearson correlation values for each comparison. The bar on the left of the map indicates the color legend of the Pearson corr. values calculated for each couple of samples in the matrix. (b) Heatmap reporting Gain/Loss State for 21022 coding/noncoding genes (y-axis) in all samples (x-axis). Red and blue colors represent, respectively, losses and gains.

