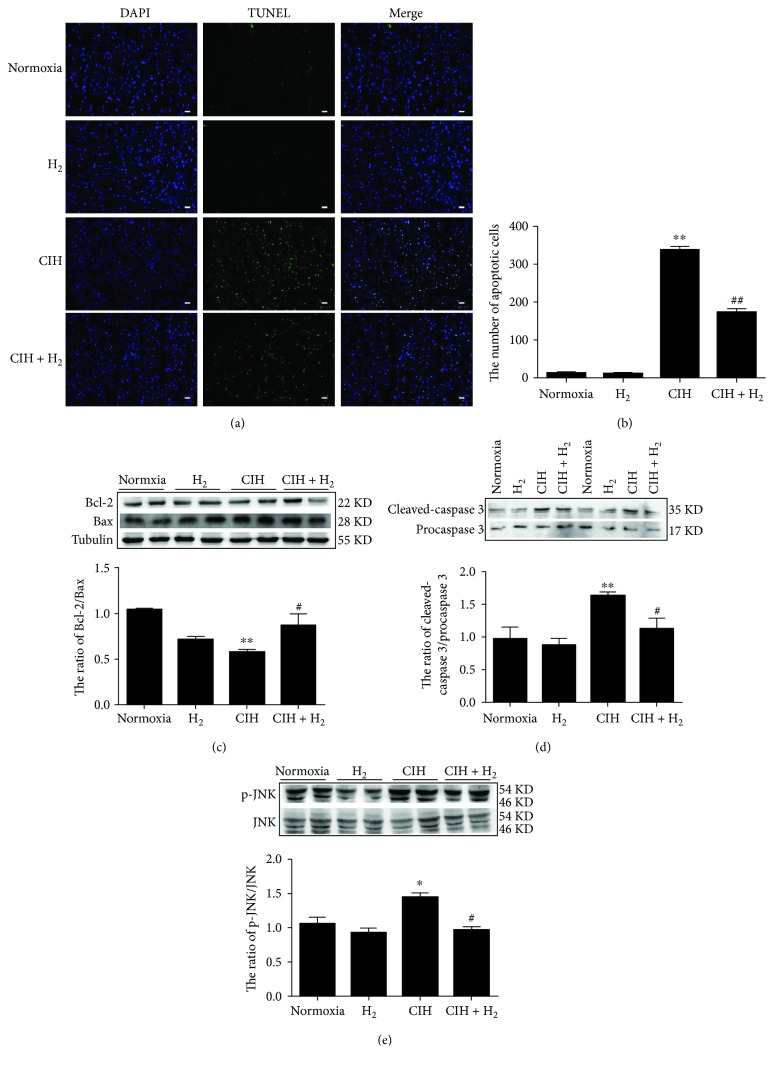
Figure 4.
The effect of the H2-O2 mixture treatment on cardiomyocyte apoptosis in the CIH model: (a) TUNEL staining (scale bar = 25 μm); (b) the number of apoptotic bodies as shown in (a); (c) the ratio of Bcl-2/Bax; (d) the ratio of cleaved-caspase 3/procaspase 3; (e) the ratio of p-JNK and JNK. The results are presented as the mean ± SEM. ∗p < 0.05; ∗∗p < 0.01 vs. normoxia group; #p < 0.05 vs. CIH group; n = 3.

