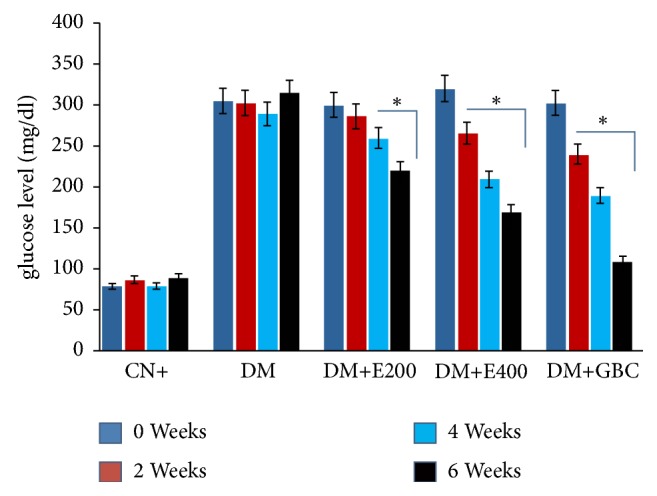
Figure 1.

Showing the glucose level of the indicated groups at 0, 2, 4, and 6 week of the treatment. All the data has been expressed as mean ± SEM of eight independent samples from each group (n = 8) analyzed by SPSS 13.0 version. All the treatment groups were statistically significant from the normal control (CN or group I). ∗: statistical difference from the positive control group, DM (group II). DM+E200: diabetic rats treated with 200mg/Kg of leaf extract (group III); DM+E400: diabetic rats treated with 400mg/Kg of leaf extract (group IV); DM+GBC: diabetic rats treated with glibenclamide (group V).
