Figure 2.
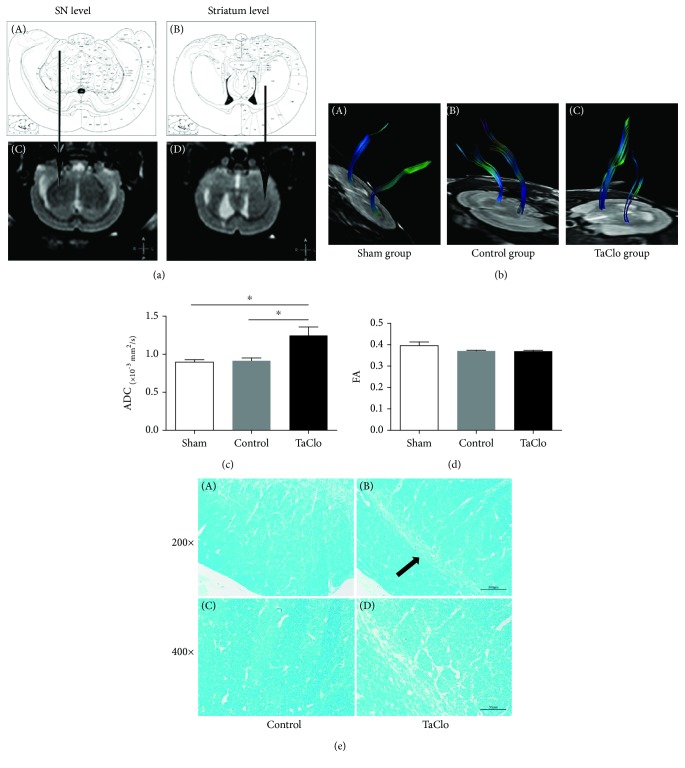
TaClo impaired the nigrostriatal system. (a) Comparison of stereotaxic coordinates in an atlas of the rat brain and the ROI assessed using DTI. Arrows pointing from A to C and from B to C show the SNc and striatum, respectively. (b) Images of the general outline of the nigrostriatal system indicate the obvious destruction of this region in the TaClo-injected rats compared to the other two groups. (c) Histogram showing a significant increase in the ADC value for the nigrostriatal system after TaClo injection. ∗ p < 0.05 compared to the control group. ∗ p < 0.05 compared to the sham group. (d) The FA value for the NP did not significantly change. (e) LFB staining showing demyelination in the SNc of the TaClo-treated rats (arrow).

