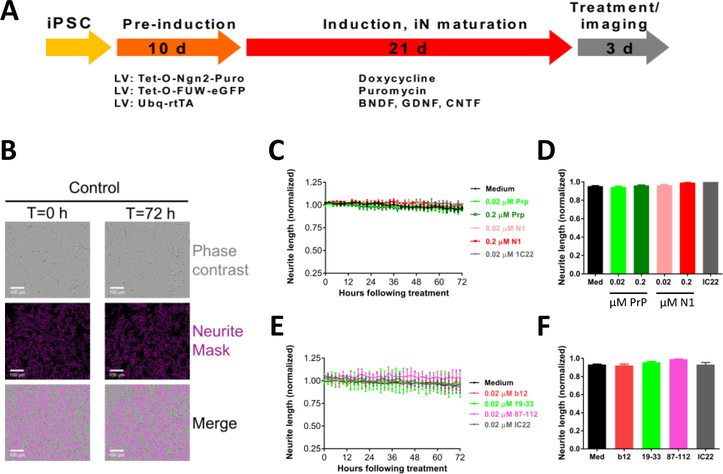
Figure 3. Live-cell imaging and analysis of neurite length in iPSC-derived human neurons.
(A) Schematic shows the timeline to generate, mature, and image iPSC-derived human neurons (iNs). (B) Upper panels: phase contrast images of iNs at the start (T=0 hours) and end of the imaging period (T=72 hours). Middle panels: images were analyzed using IncuCyte NeuroTrack algorithm for the identification of neurites (pink). Lower panels: NeuroTrack identified neurites are superimposed on the phase contrast image. The scale bar is 100 μm. To test whether mAbs, PrP, and N1 protein are compatible with our assay, iNs were treated with mAbs, PrP, or N1 in the indicated concentrations, and cells imaged for 72 hours. (C + D) Time-course plots are similar for iN cells treated +/− mAbs, PrP or N1 protein. Each data point is the average of 3 wells ± SD. (D + E) Neuritic length was averaged over the last 6 h of imaging, and values normalized to pre-treatment measurements.

