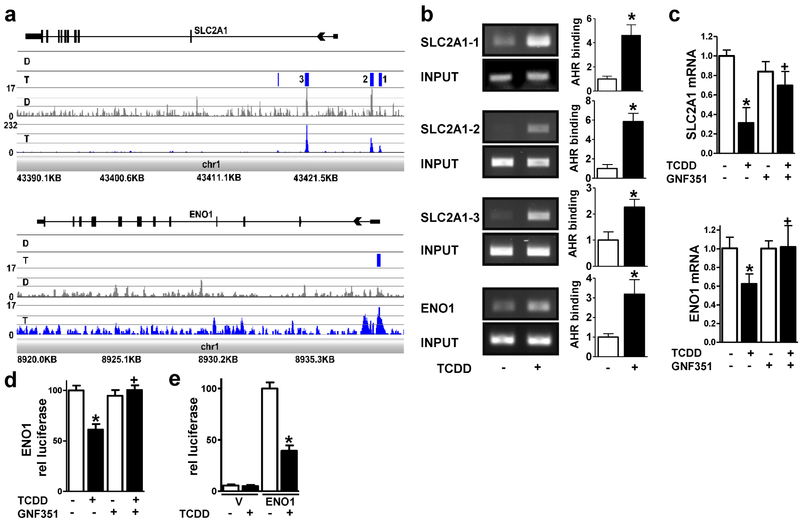
Figure 1. The AHR decreases SLC2A1 and ENO1 expression in NHEKs.
(a) ChIP-Seq analyses identify SLC2A1 and ENO1 as direct targets of the AHR. From the bottom to the top of each browser image, the first track displays the chromosomal location of the mapped reads. The next track shows the peak height in the TCDD (T, blue)- and DMSO (D, grey)-treated samples. The third track displays the statistical analyses, where statistically significant peaks are identified as a blue box. For the SLC2A1 gene, four significant peaks were identified (p < 1e-045 – p < 2.015e-017) in the TCDD-treated sample compared to the DMSO control. The peaks labeled as 1-3 were within +/− 5 kilobases of the transcriptional start site of SLC2A1. For ENO1, one statistically significant peak was identified (p < 9e-004) in the TCDD-treated sample compared to the DMSO control. The final track at the top of each image displays the gene structure. (b) ChIP-PCR verifies SLC2A1 and ENO1 as AHR targets. Representative images (left) and quantitation (right) corresponding to PCR of the three peaks within +/− 5 kilobases of the transcriptional start sites in SLC2A1 and one peak in ENO1 identified in (a). AHR binding [mean (n=3) +/− SD] was determined by densitometry. Levels of AHR binding were normalized with input and expressed in units relative to the vehicle control. *indicates a significant difference versus vehicle control, p < 0.05 by two-tailed Student’s t-test. (c) SLC2A1 and ENO1 transcripts are regulated in an AHR-dependent manner. Expression of SLC2A1 and ENO1 mRNA following treatment with or without (+/−) the AHR ligand, TCDD (24 hours), and +/− the AHR antagonist, GNF351 (100 nM, 24 hours) as indicated. Relative levels of mRNA [mean (n =4) +/− SD] were normalized with TUBA1C. (d) Transcription from the ENO1 promoter (1550 base pairs) is repressed by TCDD and is dependent on the AHR. Stable ENO1-luc integrant N/TERT-1 cells were treated with or without (+/−) the AHR ligand, TCDD (48 hours), and +/− the AHR antagonist, GNF351 (100 nM, 48 hours) as indicated. Relative levels of luciferase (mean +/−SEM) were determined from two replicate experiments, each with n=6. (e) Transcription from the ENO1 promoter (189 base pairs) is repressed by TCDD. NHEKs transfected with the vector (V) or ENO1 promoter (ENO1) were treated with or without (+/−) the AHR ligand, TCDD (72 hours) as indicated. Relative levels of luciferase (mean +/−SEM) were determined from four replicate experiments, each with n=3-6. * indicates a significant difference versus the vehicle control, p < 0.05 and + indicates a significant difference versus TCDD only, p 0.05 by two-way ANOVA followed by Tukey post hoc tests.

