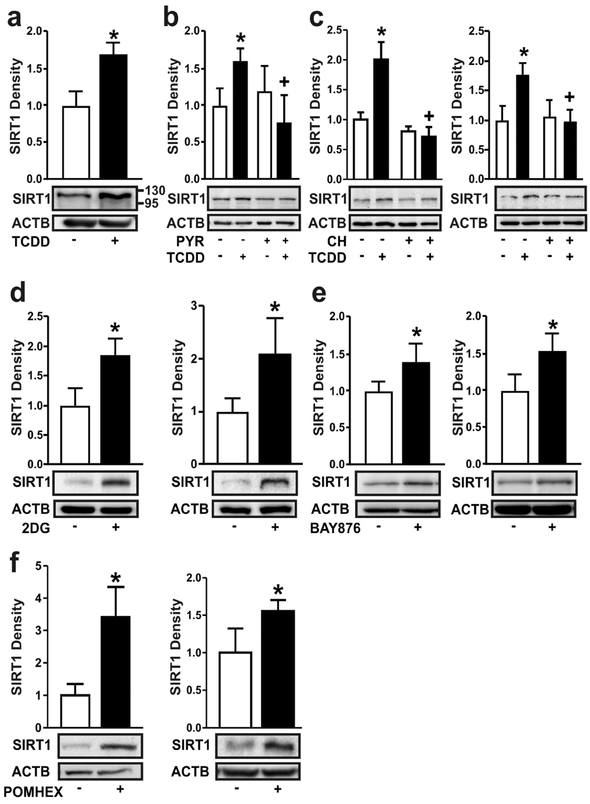
Figure 3. Ligand-activation of the AHR increases SIRT1 by nutrient deprivation, similar to chemical inhibition of glycolysis, glucose transport or enolase.
(a) SIRT1 protein was measured in NHEKs treated with TCDD for 72 hours. (b) SIRT1 protein was measured in NHEKs treated with TCDD +/− sodium pyruvate (PYR, 5 mM) for 72 hours. (c) SIRT1 protein was measured in NHEKs (left) and N/TERT-1 cells (right) treated with TCDD +/− CH223191 (1 μM) for 48 hours. (d) SIRT1 protein was measured in NHEKs (left) and N/TERT-1 cells (right) treated with 2DG (20 mM) for 48 hours. (e) SIRT1 protein was measured in NHEKs (left) and N/TERT-1 cells (right) treated with the select SLC2A1 inhibitor, BAY876 (5 μM) for 48 hours. (f) SIRT1 protein was measured in NHEKs (left) and N/TERT-1 cells (right) treated with the enolase inhibitor, POMHEX (25 μM) for 48 hours. For all immunoblots, representative images are shown and levels of protein [mean (n =4) +/− SD] were normalized with ACTB. * indicates a significant difference versus the vehicle control, p < 0.05; + indicates a significant difference versus TCDD only, p < 0.05. For single comparisons, a two-tailed Student’s t-test was used. For multiple comparisons, data were analyzed using two-way ANOVA followed by Tukey post hoc tests.

