
Figure 3:
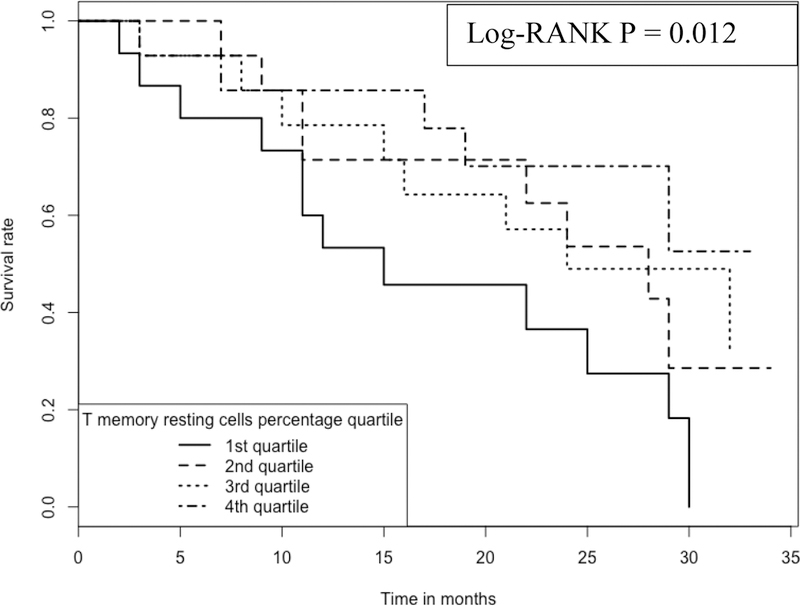
Kaplan-Meier curve comparing 57 IPF patients with different RM T cell proportions Note: 1.Data come from dataset 3 (GSE93606). 2. Log-RANK p value is for comparison between subjects with cell proportions at the 1st or the 4th quartiles, respectively.