
Figure 9:
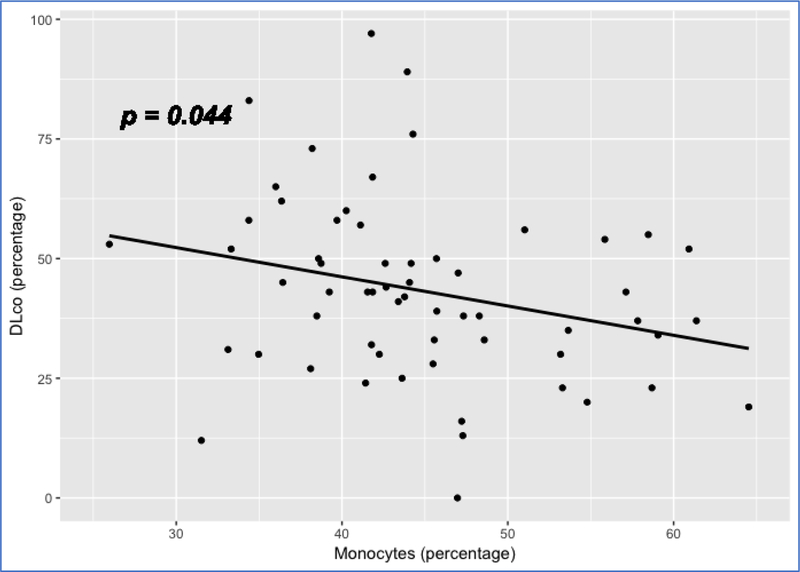
Scatterplot showing the linear relation between monocyte proportion and DLco Note: 1. Data come from dataset 4 (GSE38958). 2. P value is based on a full regression model adjusted for age, gender and ethnicity
Official websites use .gov
A
.gov website belongs to an official
government organization in the United States.
Secure .gov websites use HTTPS
A lock (
) or https:// means you've safely
connected to the .gov website. Share sensitive
information only on official, secure websites.
Scatterplot showing the linear relation between monocyte proportion and DLco Note: 1. Data come from dataset 4 (GSE38958). 2. P value is based on a full regression model adjusted for age, gender and ethnicity