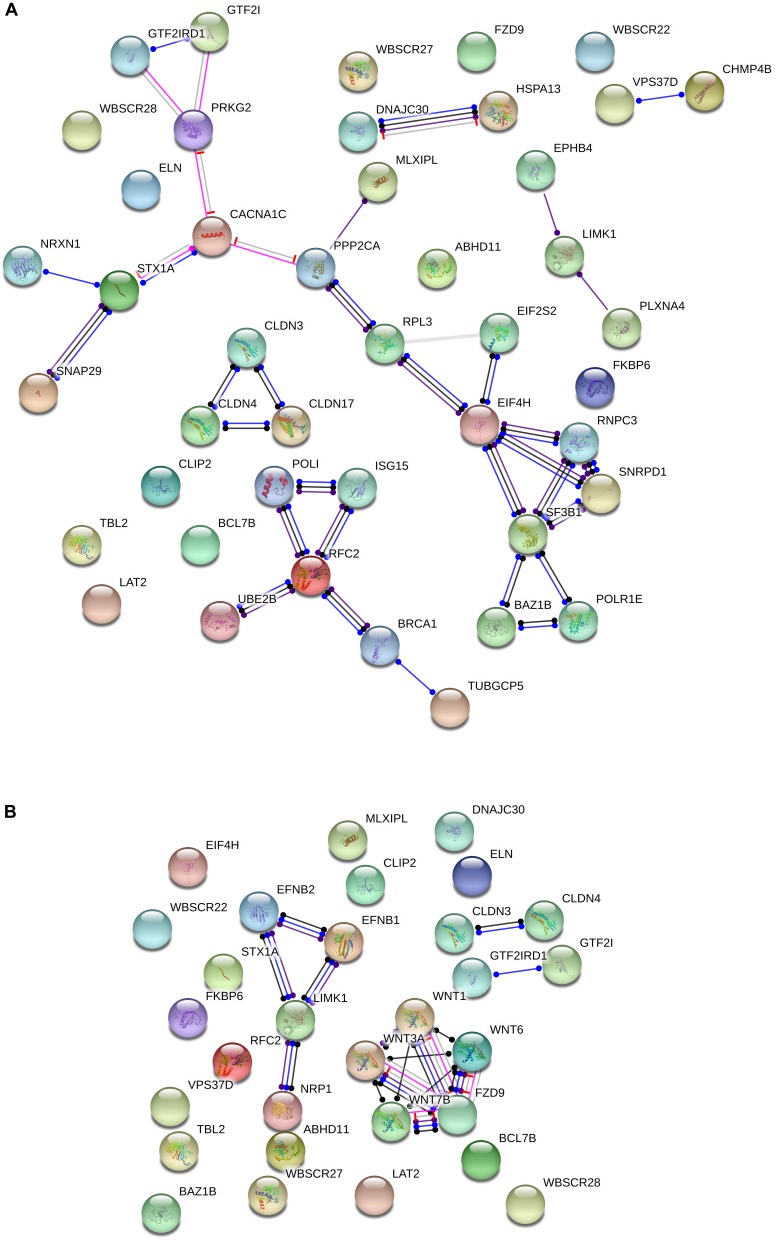
FIGURE 2.
Functional interactions among the WS genes and candidates for domestication (A) and NC development and function (B). The diagrams show the network of known functional interactions among the proteins encoded by the genes. The networks were drawn with String (version 10.5; Szklarczyk et al., 2015) license-free software (http://string-db.org/), using the molecular action visualization. Colored nodes symbolize the proteins. The color of the edges represents different kind of known protein-protein associations. Green: activation, red: inhibition, dark blue: binding, light blue: phenotype, dark purple: catalysis, light purple: post-translational modification, black: reaction, yellow: transcriptional regulation. Edges ending in an arrow symbolize positive effects, edges ending in a bar symbolize negative effects, whereas edges ending in a circle symbolize unspecified effects. The medium confidence value was 0.0400 (a 40% probability that a predicted link exists between two enzymes in the same metabolic map in the KEGG database: http://www.genome.jp/kegg/pathway.html). The diagram only represents the attested connectivity between the involved proteins, derived from curated databases or experimentally determined, but it has to be mapped onto particular biochemical networks, signaling pathways, cellular properties, aspects of neuronal function, or cell-types of interest to gain a more accurate view of its relevance for the presentation of domesticated features in WS (see the main text for details).

