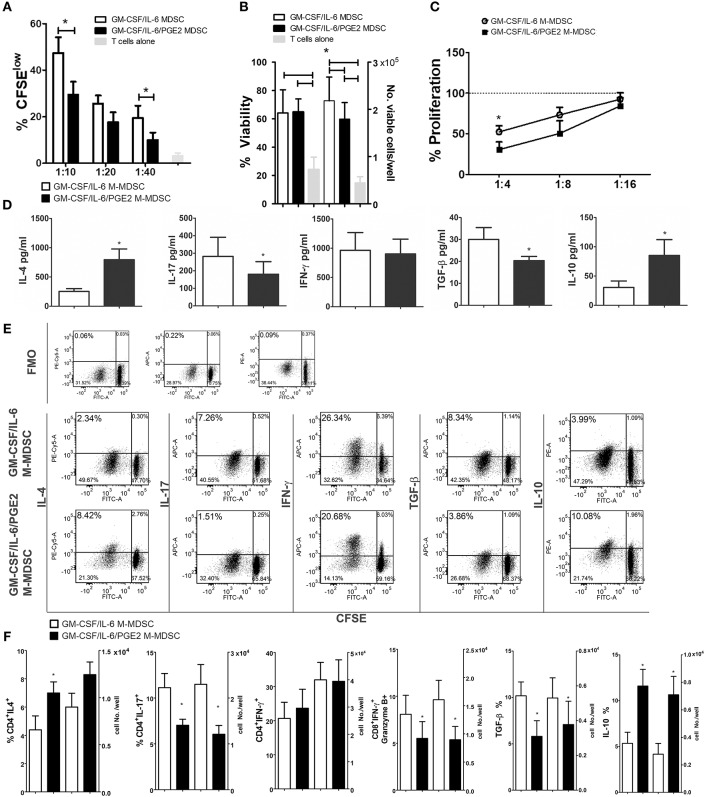
Figure 4.
Effects of LPS/IFN-γ-stimulated M-MDSC on proliferation and differentiation of allogeneic T cells. (A) The proliferation of MACS-purified allogeneic CFSE-labeled T cells (1 × 10⁵/well) in the presence or absence of different number of LPS/IFN-γ-stimulated M-MDSC (1 × 10⁴-0.25 × 10⁴/well) was determined by flow cytometry after 5 days of co-cultivation, and the results from one representative experiment are shown as mean proliferation % ± SD of triplicates. (B) The viability and cell number of the T cells/well was determined on Muse Cell Analyzer, as described, and the data is presented as mean ± SD of 5 independent experiments. (C) The proliferation of allogeneic T cells in the presence of CD3/CD28 stimulation and different number of LPS/IFN-γ-stimulated M-MDSC (2.5–0.62 × 10⁴/well) was determined by flow cytometry after 5 days of cultivation, and the results are shown as mean relative proliferation ± SD, i.e., % proliferation of control CD3/CD28-stimulated T cells (100%) from 3 independent experiments. (A,B) *p < 0.05 GM-CSF/IL-6 M-MDSC vs. corresponding GM-CSF/IL-6/PGE2 M-MDSC (RM ANOVA, Tukey post-test). (D) The levels of indicated cytokines, shown as mean pg/ml ± SD, were determined from the supernatants of 1:10 M-MDSC/T cell co-cultures carried out as in (A) and treated for 4 h with PMA/Ca ionophore. The levels of cytokines were standardized to 1 × 10⁵ of viable T cells from the co-cultures. (E) Expression of intracellular cytokines was determined within CFSE-labeled T cells co-cultivated at 1:10 cell ratio as in (A) and treated for 3 h with PMA/ionomycin/monensin. Data from one representative experiment are shown. (F) The percentages and cell number of CD4+ IFN-γ+, CD4+ IL-4, CD4+ IL-17, CD8+ IFN-γ+ Granzyme B+, TGF-β+, and IL-10+cells were determined by flow cytometry from the M-MDSC/T cell co-cultures carried out at 1:10 cell-to-cell ratios as in (A) and treated for 3 h with PMA/ionomycin/monensin. The cell number was calculated from the absolute number of viable T cells after the cultures (B) and % of positive cells from flow cytometry. *p < 0.05 paired T-test.

