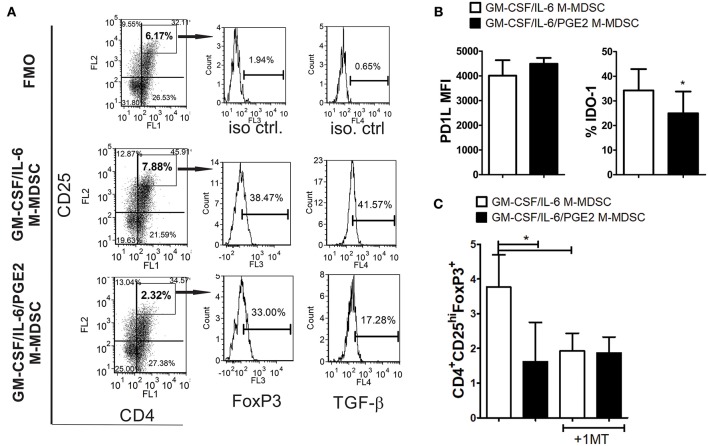
Figure 5.
The capacity of LPS-IFN-γ stimulated M-MDSC to induce FoxP3+ Treg. (A) A representative analysis of FoxP3+ Treg is shown from the experiments in which M-MDSC (2 × 10³/well) were co-cultivated with allogeneic T cells for 3 days, followed by IL-2 treatment for the next 3 days. The presented histograms of FoxP3 and TGF-β are shown from CD4+CD25hi gates, and the markers were set according to FMO control. (B) The surface expression of PD-L1 and intracellular expression of IDO-1 were determined by flow cytometry after the staining of LPS/IFN-γ stimulated M-MDSC, and the results are shown as mean MFI or % ± SD of 3 independent experiments. *p < 0.05 paired T-test. (C) The summarized data are shown on the % of CD4+CD25hiFoxP3+ cells ± SD (n = 3) induced in the co-cultures with M-MDSC that were carried out as in (A), either in the presence or absence of 1-MT. *p < 0.05 as indicated by line (RM ANOVA, Tukey post-test).

