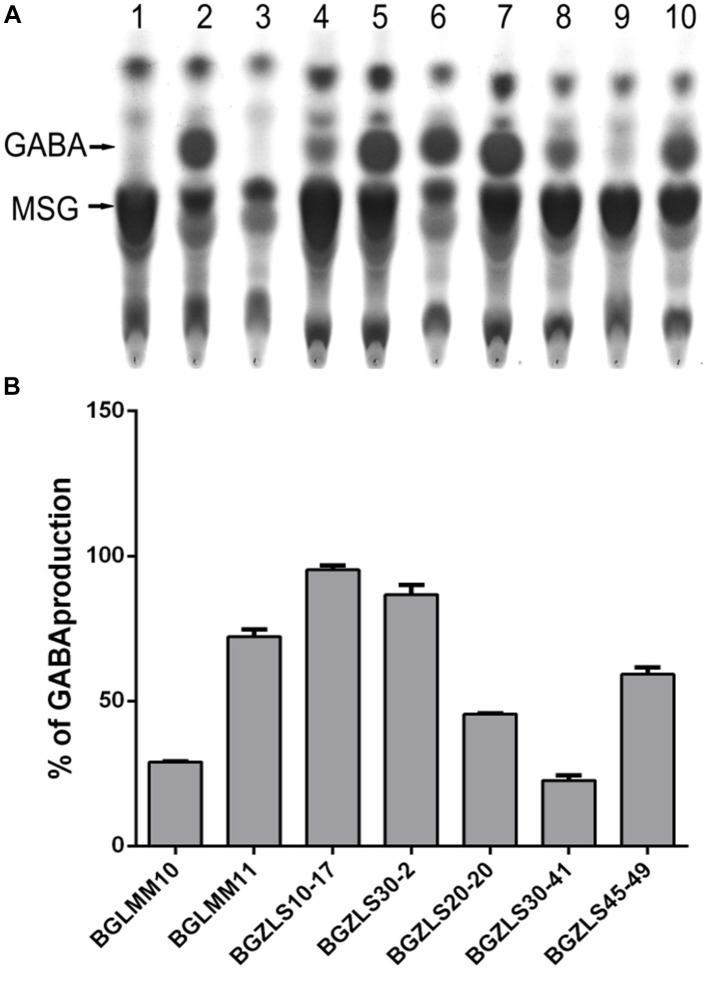
FIGURE 1.
(A) TLC chromatogram of GABA production. Lane 1, MSG in MRS; Lane 2, GABA in MRS; Lane 3. MRS; Lane 4, BGLMM10; Lane 5, BGLMM11; Lane 6, BGZLS10-17; Lane 7, BGZLS30-2; Lane 8, BGZLS20-20; Lane 9, BGZLS30-41; Lane 10, BGZLS45-49. Arrows indicate MSG and GABA. (B) Conversion of MSG to GABA. The percent of MSG conversion to GABA is indicated on y-axis. The bars represent GABA production of Lactobacillus isolates. Data from three independent experiments are expressed as mean ± SD.

