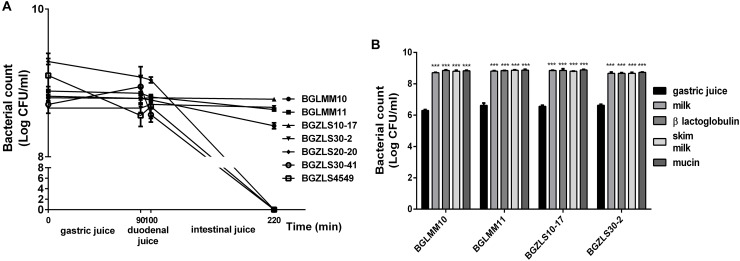
FIGURE 2.
(A) Resistance to simulated gastrointestinal conditions. Survival of selected Lactobacillus isolates, as indicated on the right, under gastric conditions (0–90 min), duodenal (90–100 min) and intestinal conditions (100–220 min). The values are the averages of three replicates, and standard deviations are indicated by vertical bars. (B) Gastric tolerance at pH 2.0 in the presence of skim milk, milk proteins and mucin. All values are reported as a mean ± SD of 3 replicates. Statistical significance of gastric tolerance enhancement is shown (∗∗∗p < 0.001).

