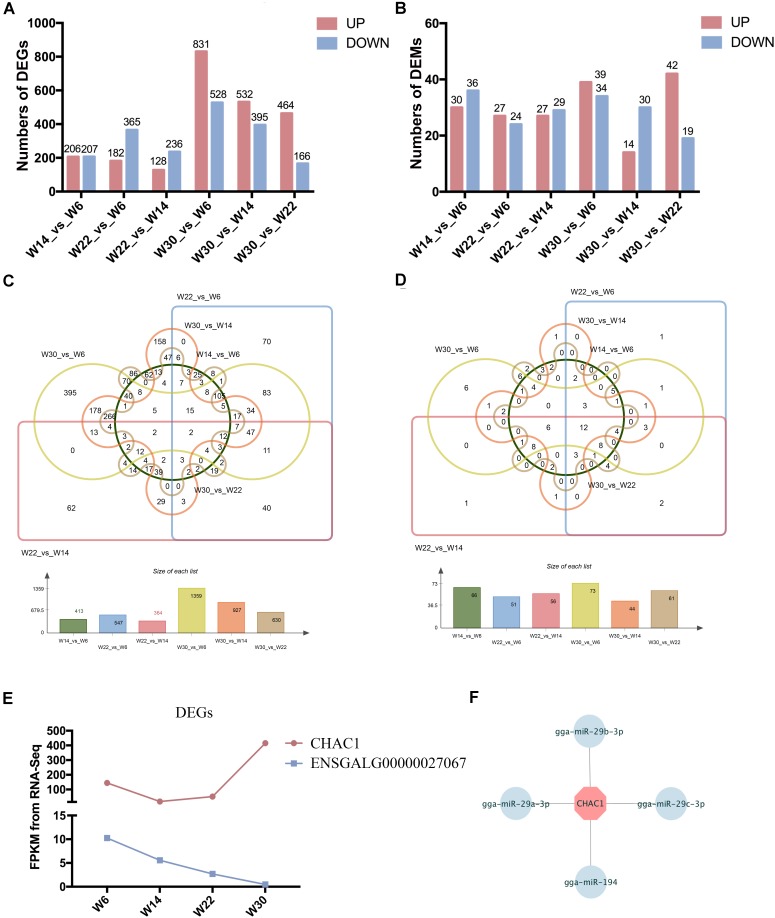
FIGURE 1.
The differentially expressed genes (DEGs) and miRNAs (DEMs) in chicken breast muscle. (A) The numbers of DEGs in different comparisons. (B) The numbers of DEMs in different comparisons. (C) The Wayne diagram of DEGs among the six comparisons. (D) The Wayne diagram of DEMs among the six comparisons. (E) The FPKM value of two DEGs (CHAC1 and ENSGALG00000027067) in four developmental stages of chicken breast muscle. (F) The miRNA–mRNA pairs of CHAC1.

