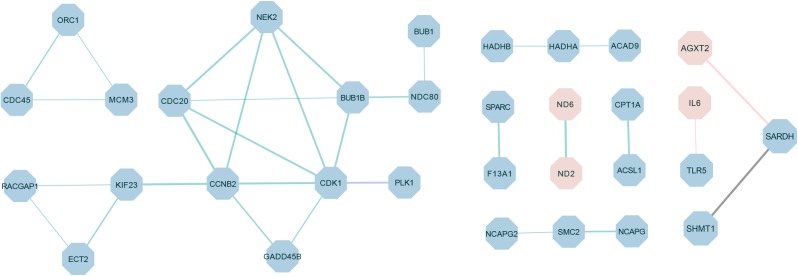
FIGURE 6.
The protein–protein interaction (PPI) network of differentially expressed proteins in different comparisons. The green connection represents W22 vs. W6, the purple connection represents W22 vs. W14, the red connection represents W30 vs. W6 and the black connection represents W30 vs. W14. Red represents up-regulated genes, and blue represents down-regulated genes. The thickness of the lines indicates the level of confidence in protein interactions.

