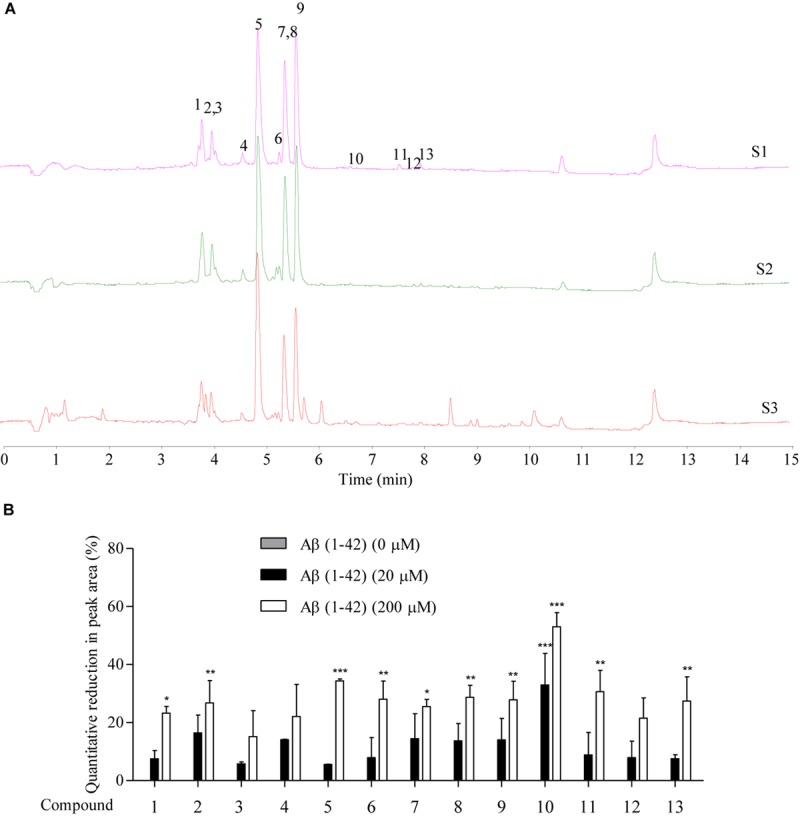
FIGURE 2.

The prediction of Aβ-binding propensity of chemical components in SB using Agilent 6230 UHPLC-DAD-TOF/MS. (A) The TIC of SB-TEE with or without the incubation with 20 and 200 μM Aβ (1–42). S1: SB-TEE; S2: The incubation of SB-TEE with 20 μM Aβ (1–42); S3: The incubation of SB-TEE with 200 μM Aβ (1–42). (B) The bar chart shows the percentage of reduction (%) in the peak area of each SB component in TIC after their incubation with 20 or 200 μM Aβ (1–42). Columns means of 3 independent experiments; bars, SEM. ∗p < 0.05, ∗∗p < 0.01 and ∗∗∗p < 0.001 vs. 0 μM Aβ (1–42) group.
