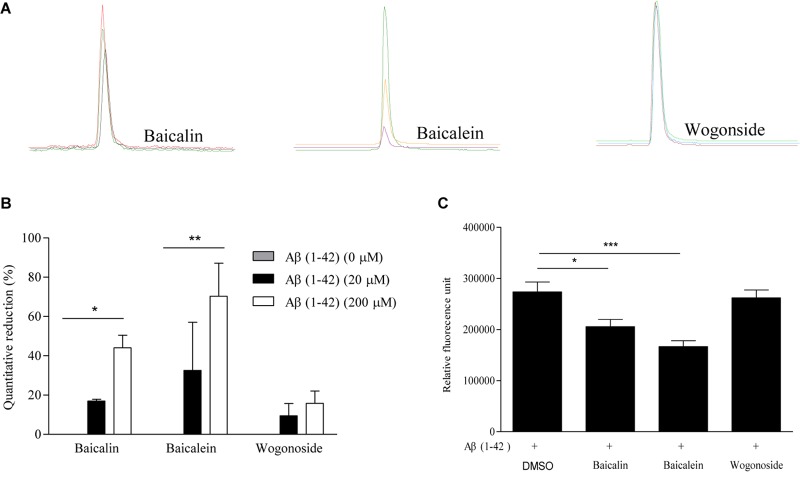
FIGURE 3.
The validation of the Aβ-binding propensity of chemical components by ThT fluorescence assay. (A) The extracted-ion chromatogram (EIC) of the selected SB components (baicalin, baicalein, and wogonoside) after incubation with 20 and 200 μM Aβ (1–42). (B) The bar chart shows the quantitative reduction (%) in the peak area of baicalin, baicalein, and wogonoside in TIC after incubation with 20 and 200 μM Aβ (1–42). The data was expressed as the mean ± SEM. ∗p < 0.05 and ∗∗p < 0.01 vs. 0 μM Aβ (1–42). (C) The inhibitory effect of representative compounds on Aβ (1–42) fiber formation measured by ThT fluorescence intensity detection. The data was expressed as the mean ± SEM. ∗p < 0.05 and ∗∗∗p < 0.001 vs. 20 μM Aβ (1–42) alone group.

