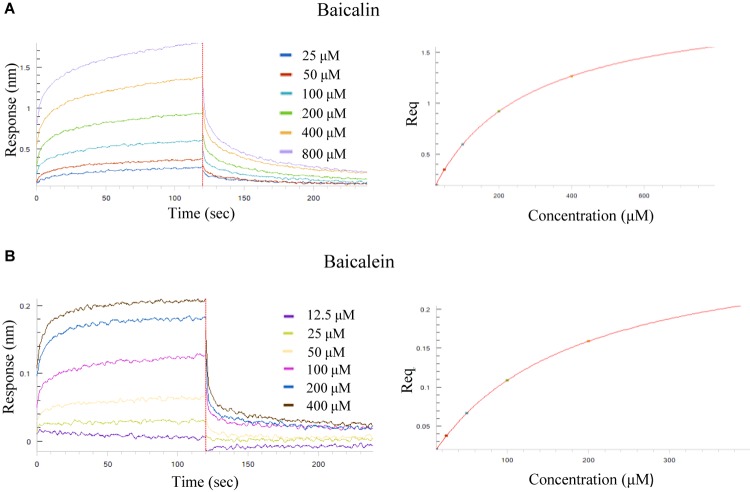
FIGURE 4.
Kinetic measurement of the binding affinity of baicalin and baicalein to Aβ (1–42) fibril by BLI assay. (A) Kinetic binding sensorgrams of increasing concentrations of baicalin from 25 to 800 μM were showed with real-time data acquisition for each step of the kinetic assay. (B) Kinetic binding sensorgrams of increasing concentrations of baicalein from 12.5 to 400 μM. Response/binding (nm) represents the optical thickness of the sensor layer reflected by the spectral shift (Δλ) upon the interaction of baicalin or baicalein with Aβ (1–42). The response at steady state where the rate of association equal to the dissociation, the equilibrium binding signal (Req) indicated by flattened curve is reached.

