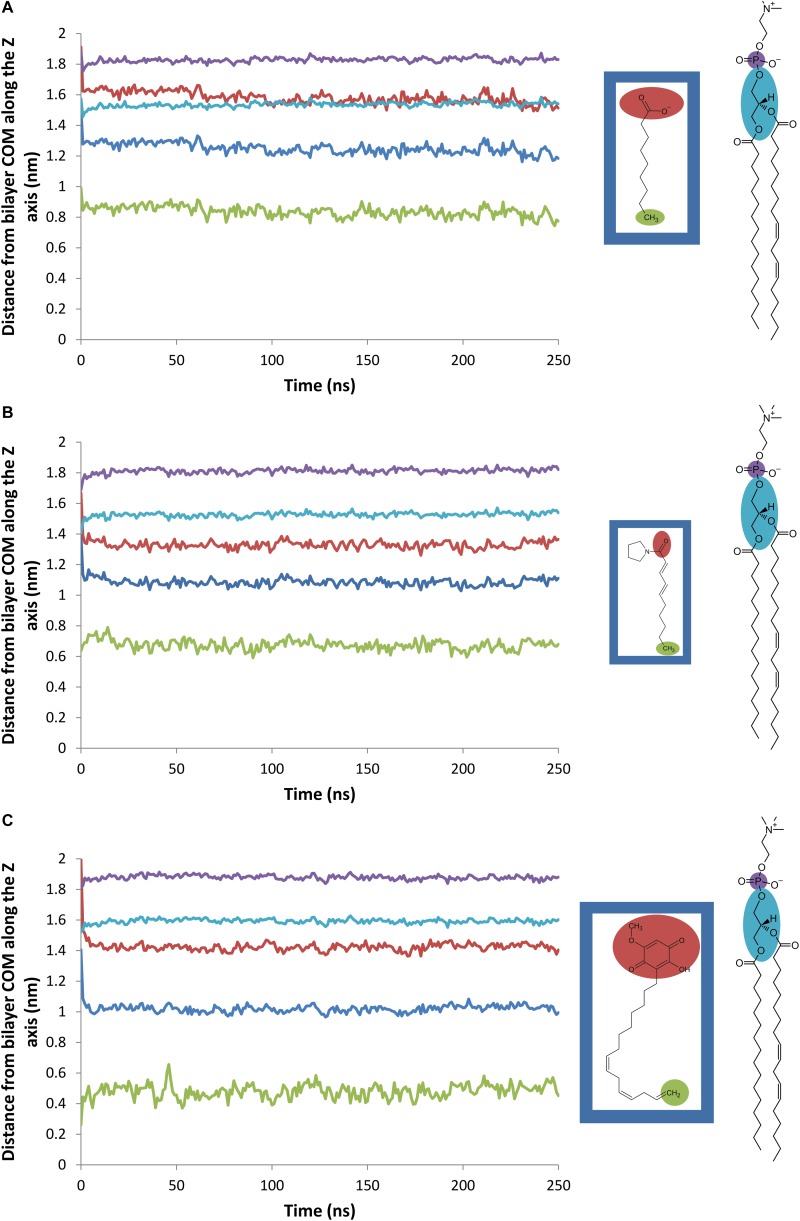
FIGURE 6.
Evolution of the average distance between various atomic groups and the PLPC bilayer center of mass along the Z-axis (nm). Blue line: herbicide (A: nonanoic acid, B: sarmentine, and C: sorgoleone) COM, red line: herbicide (A: nonanoic acid, B: sarmentine, and C: sorgoleone) polar part (defined as shown on the inset), green line: last methyl group of herbicide (A: nonanoic acid, B: sarmentine, and C: sorgoleone) alkyl chain, violet line: PLPC phosphorus atoms, cyan line: PLPC glycerol groups.

