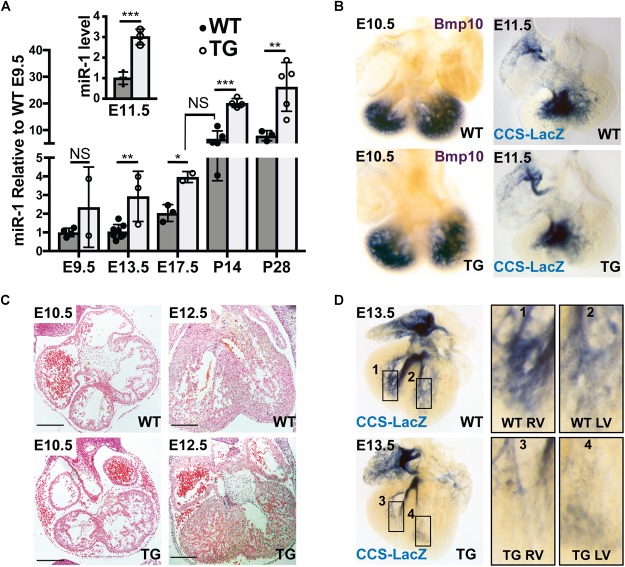
FIGURE 2.
Hypoplasia of Ventricular Conduction System in miR-1 TG Embryos. (A) Quantitative PCR for mature miR-1 transcript in miR-1 TG hearts versus WT hearts at several stages of development shows that miR-1 expression is elevated in mid-gestation embryos and rises to adult levels in the perinatal period, anticipating the normal developmental upregulation of miR-1. The inset shows relative expression of miR-1 versus WT at E11.5. “∗” denotes p < 0.05, “∗∗” denotes p < 0.01, and “∗∗∗” denotes p < 0.001. (B) Whole-mount in situ hybridization at E10.5 for Bmp10 in WT (top, left) and TG (bottom, left) and VCS development at E11.5 as assessed by whole-mount bluo-gal staining of a miR-1 TG heart (bottom, right) alongside a WT littermate (top, right) in the CCS-LacZ background. Note the similar distribution of reporter expression. (C) Light microscopic examination of embryonic hearts sectioned at E10.5 (left) and E12.5 (right) in WT (top) and miR-TG (bottom). Scale bars = 200 microns. (D) Whole-mount imaging of CCS-Lacz reporter activity at E13.5, after the onset of miR-1 upregulation in miR-1 TG mice, demonstrates a striking paucity of VCS tissue in the transgenic heart (bottom row) versus a WT littermate (top row). Panels 1–4 on the right show magnified images of developing RV (1,3) and LV (2,4) PF density in WT (1,2), and TG (3,4) hearts.

