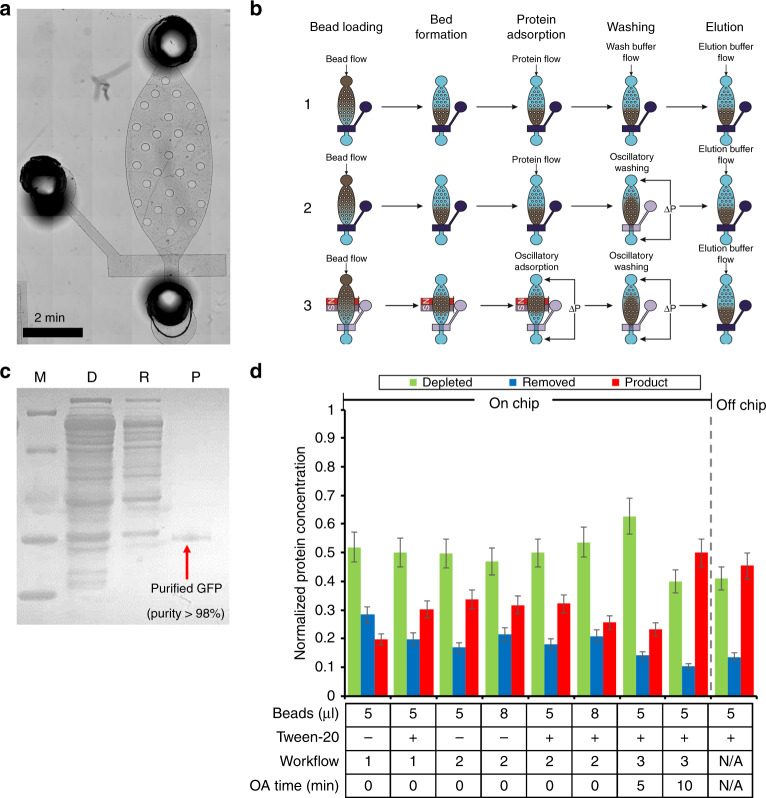
Fig. 3. Protein purification in a microfluidic chamber.
a A microscopic image of the purification module. b Overview of the purification procedure (including bead loading, bed formation, protein adsorption, washing, and elution) by three different workflows. Workflow 1 uses flow adsorption and washing steps. Workflow 2 uses flow adsorption and oscillatory washing. Workflow 3 uses oscillatory adsorption and washing. Dark blue denotes a closed valve, where transparency denotes an open valve. c SDS-PAGE of GFP purified by the purification chip. M (Marker); D (Depleted): CFPS reaction mix after bead absorption; R (Removed): removed contaminates in the purification buffer; P (Product): purified GFP in the elution buffer. d The purification step optimization. Optimization was conducted by examining 4 conditions. (1) Ni-NTA bead volume of 5 or 8 µl; (2) 0.5% Tween-20 added into purification and elution buffers. (3) Different workflows. (4) Different oscillatory adsorption times

