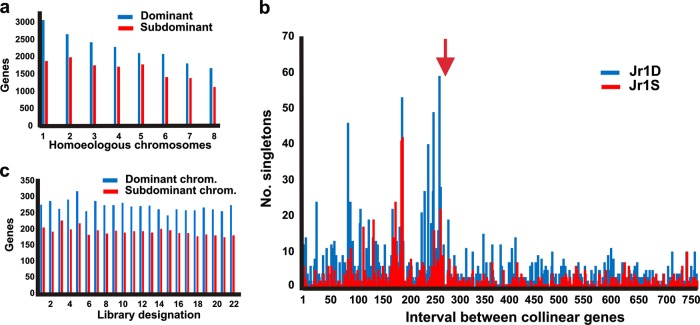
Fig. 3. Asymmetric gene fractionation of the Juglandoid WGD.
a Numbers of genes annotated on the JrSerr_v1.0 dominant and subdominant pseudomolecules. Numbers on the horizontal axis are designations of individual Juglans homoeologous groups, each consisting of one dominant (D) and one subdominant (S) chromosome. b Numbers of singleton genes in intervals delimited by conserved paralogues on the dominant chromosome Jr1D and subdominant homoeologues Jr1S. The homoeologous pseudomolecules Jr1D and Jr1S were subdivided into intervals delimited by successive pairs of paralogous genes in collinear locations on the homoeologues. The noncollinear genes (singletons) were counted in each interval (histogram bars) in the dominant pseudomolecule (blue) and subdominant pseudomolecule (red). The starting nucleotides of the pseudomolecules are to the left. The red arrow indicates the location of the centromere in the dominant pseudomolecules. c Numbers of genes on the pseudomolecule of the dominant chromosome Jr1D (blue) and subdominant chromosome Jr1S (red) showing dominant expression (two-fold higher expression than that of the orthologous gene) in 22 different Juglans regia RNAseq datasets. The description of the RNAseq datasets (coded at the horizontal axis of the graph) is in Fig. S12 and Table S20

