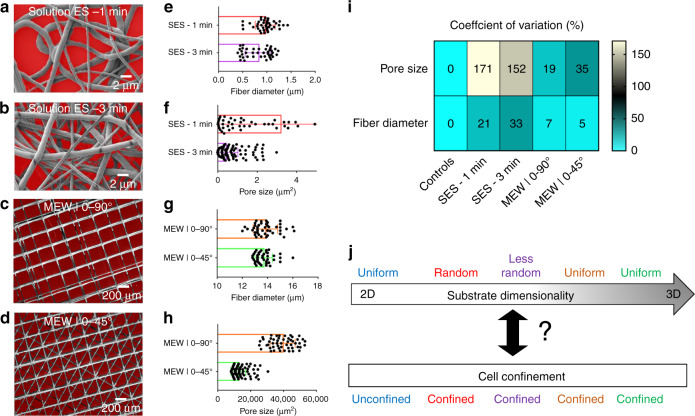
Fig. 3. Dimensional metrology of fibrous meshes.
a, b SEM micrographs of 2D nonwoven fibrous meshes overlaid with segmented effective pore size areas (red color). c, d SEM micrographs of the 3D woven fibrous meshes with different architectures, overlaid with segmented effective pore size areas (red color). e–h Bar graphs depicting the mean fiber diameter ([μm], SI) and the mean effective pore size area along with standard deviation based on the image-based segmentation results for each 2D non-woven fiber mesh (e, f) and 3D woven fiber mesh (g, h). Mean and standard deviation values are calculated based on random individual fiber and effective pore size measurements (n = 30–50) denoted as scatter points in each bar graph. i Coefficient of variation [%] of the calculated dimensional metrics for each substrate under investigation. j Upper part: sample categorization based on their physical dimensionality and fiber architecture: a Controls (glass coverslip) as “2D uniform”, “SES-1 min” as “2D random”, “SES-3 min” as “2D less random”, “MEW|0–90°” as “3D uniform” and “MEW|0–45°” as “3D uniform”. Lower part: hypothesized corresponding confinement states induced by each substrate based on representative cell morphologies

