
Figure 2.
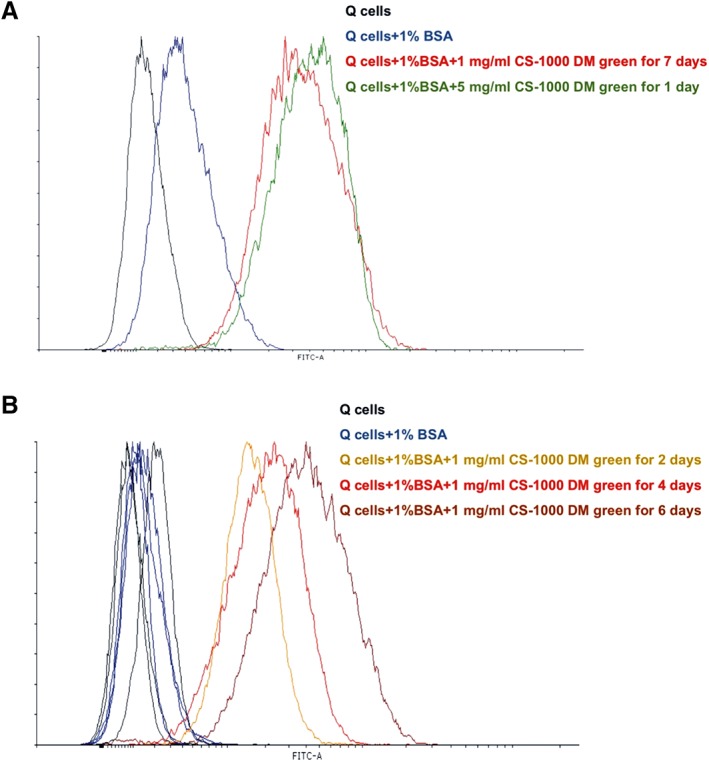
Flow cytometry of CS‐1000 DM green‐labeled cells. (A): Adding 1% bovine serum albumin (BSA) produces a minimal increase in autofluorescence (blue) compared with medium alone (black). Incubation of Q‐Cells with 1 mg/ml CS‐1000 DM green for 7 days (red) and 5 mg/ml CS‐1000 DM green (green) for 1 day demonstrate similar fluorescence labeling intensities. (B): Fluorescence intensity increases homogeneously over time. Adding 1% BSA again produces a minimal increase in autofluorescence (blue) compared with incubation in medium without BSA (black). Incubation of Q‐Cells with 1 mg/ml CS‐1000 DM green over time shows increasing fluorescence intensity over time (2 days [orange], 4 days [red] and 6 days [dark red]).