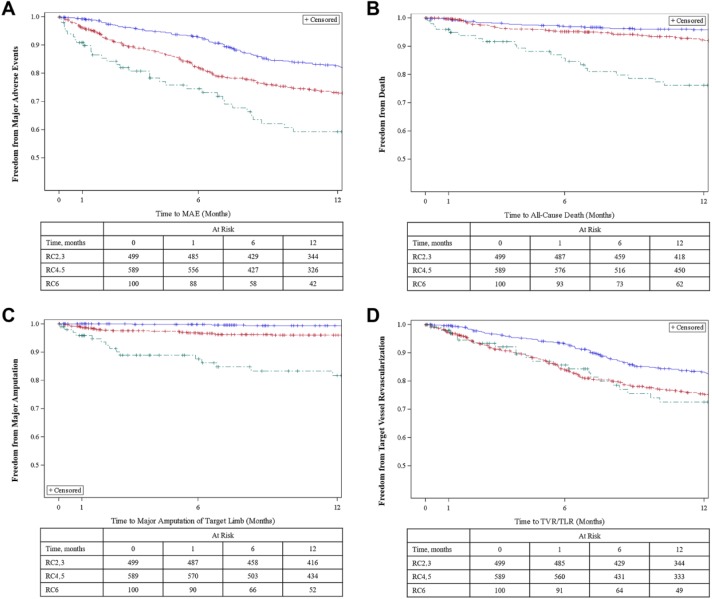
Figure 2.
Kaplan-Meier curves for (A) freedom from major adverse events, (B) death, (C) major target limb amputation, and (D) target vessel revascularization. The standard error did not exceed 10% for any group. MAE, major adverse events; RC, Rutherford category; TLR, target lesion revascularization; TVR, target vessel revascularization. The blue line represents the RC2,3 subgroup, the red line is the RC4,5 subgroup, and the green line denotes the RC6 subgroup.

