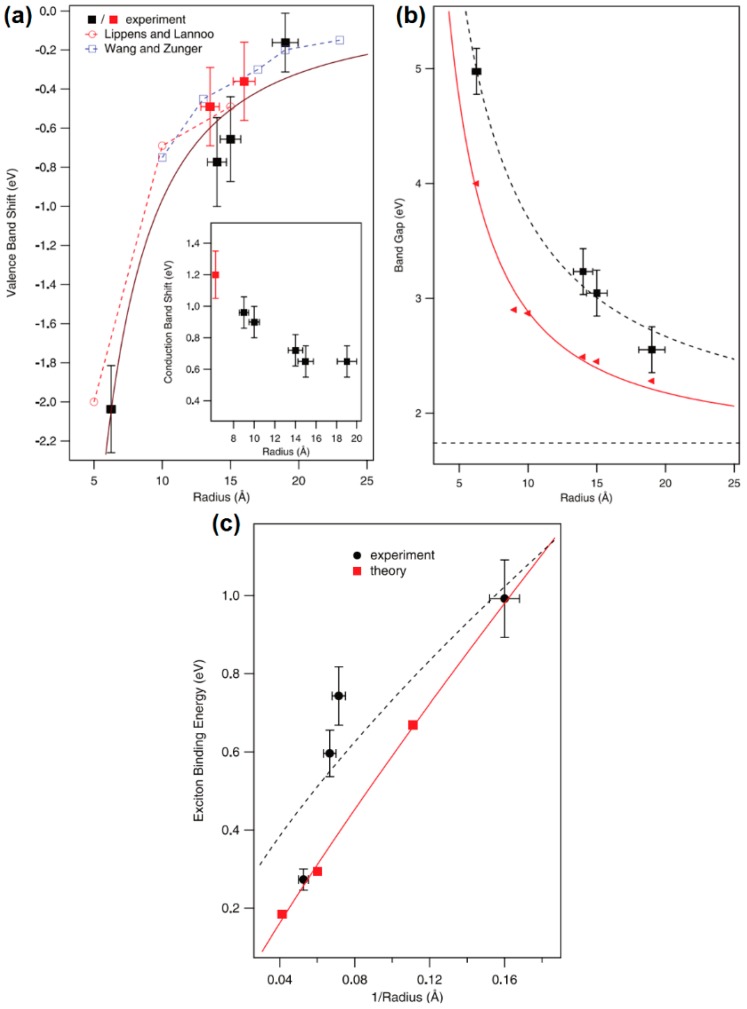
Figure 6.
(a) Variation in the positions of the valence band and (inset) conduction band extrema as a function of particle radius in CdSe QDs. The black and red filled squares represent the data points for pyridine and thioglycolic acid-functionalized CdSe QDs, respectively, while the open circles and squares represent theoretical values. (b) Effect of the CdSe QD particle radius on the electronic bandgap. The black presents the CdSe QD photoemission bandgaps while the red represents the CdSe QD optical absorption band gaps. (c) Exciton binding energy of CdSe QDs as a function of particle radius. The black dots represent the CdSe-TOPO QD experimental exciton binding energy while the red squares represent the theoretical values. Adapted with permission from [42]. Copyright 2009 American Chemical Society.

