Figure 1.
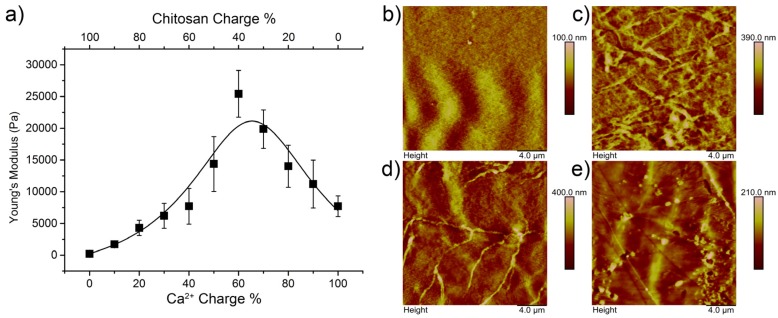
On the left a graph displaying the Young’s modulus dependent on the chitosan charge ratio (a); the line is added to guide the eye. Each point is an average of three measurements. On the right, representative AFM pictures of gels with a chitosan charge ratio of 0.0 (b), 0.2 (c), 0.4 (d), and 0.6 (e) are shown.

