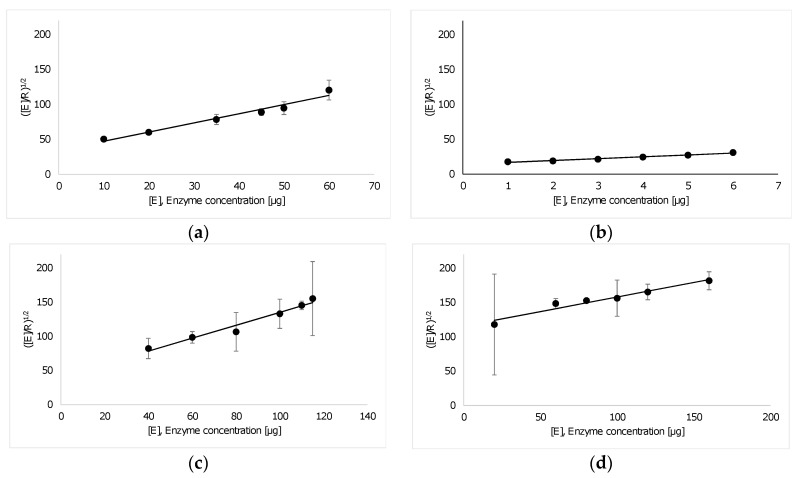
Figure 1.
Linear plots of (circles) of Impranil DLN hydrolysis as a function of the concentration of (a) LCC; (b) TfCut2; (c) Tcur0390; and (d) Tcur1278. The fitting data (solid lines) are based on the kinetic model proposed by Mukai et al. [39] (Equation (2)). Error bars indicate the standard deviation of duplicate determinations.

