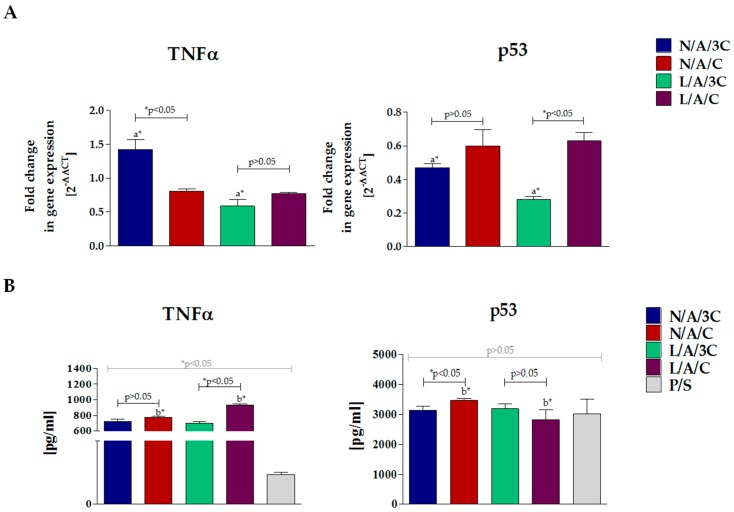
Figure 10.
(A) Results of analysis of cytokine expression in RAW264.7 cultures with biomaterials. Gene expression of p53 and TNF-α was determined with qPCR, 2−ΔΔCt method was used to calculate the quantification of relative values, normalizing data to control and including expression of reference gene (ACTβ). The secretion of cytokines measured with specific ELISA test (B). Error bars represent standard deviation from the mean calculated for normalized values obtained in three separate replicates. An asterisks (*) represent statistically significant differences (p ˂ 0.05).

