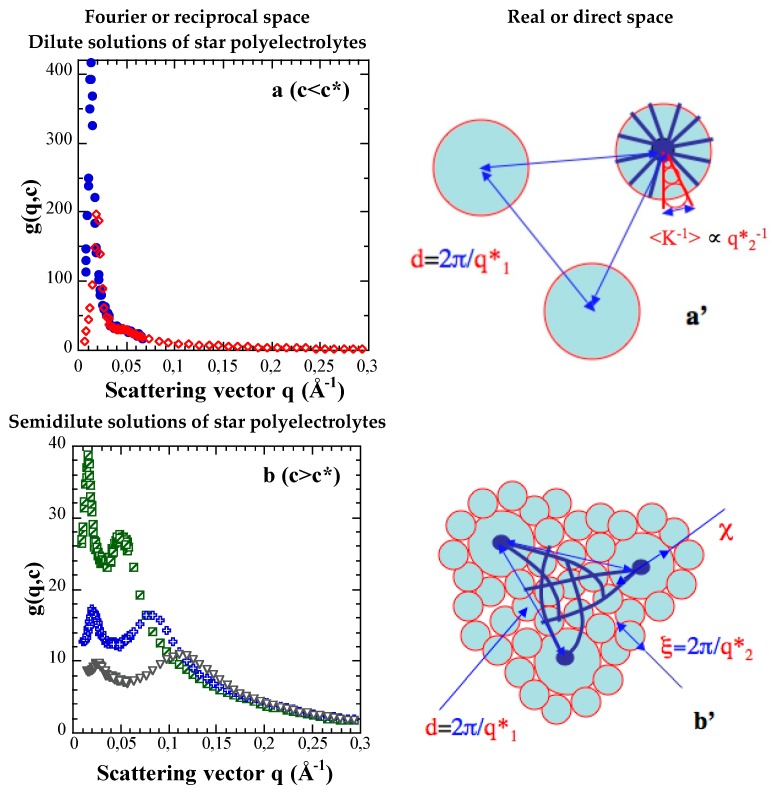
Figure 6.
Fourier space (a, b) versus real space (a’, b’). Relation between the positions of the main maxima of the NaPSS scattering functions in the reciprocal space (q1* and q2*) and the mean distances characterizing the average structure of the NaPSS star solutions in the direct space (d, <κi>−1, χ and ξ). (a and a’) S100-S91/D2O (c < c* ≈ 0.075 mol·L−1 – φ < φ* ≈ 0.83%); c = 0.013 mol·L−1 – φ = 0.14% (dotted circles); c = 0.052 mol·L−1 – φ = 0.58% (lozenges); (b and b’) S300-S94/D2O (c > c* ≈ 0.010 mol·L−1 – φ < φ* ≈ 0.11%); c = 0.088 mol·L−1 – φ = 0.98% (crossed squares); c = 0.230 mol·L−1 – φ = 2.57% (crosses); c = 0.444 mol·L−1 – φ = 4.97% (inverted triangles).

